

How to flight plan around thunderstorms using your iPad
 One of the major weather hazards pilots face this time of year is convective weather and resulting thunderstorms. No airplane is equipped to fly through a thunderstorm, and for obvious reasons, planning to fly around them should be the primary goal.
The weather patterns across the entire U.S. become quite active as the days get longer and warmer, providing the necessary ingredients for storms to form. Compared to winter, this often means more VFR flying days without concern for aircraft icing, but it also means pilots have to pay more attention to cold fronts and afternoon heating, both of which regularly contribute to the formation of strong storms.
This planning begins with the preflight weather briefing, which will have a different focus when performed for a flight in the summer vs. the winter. Fortunately, the FAA has fully endorsed the self-briefing process in an Advisory Circular, giving pilots the option to go about the briefing on their own online or in a mobile app like ForeFlight, or to still retrieve a standard weather briefing from Flight Service.
You would be at a disadvantage if you chose to solely rely on Flight Service for your briefing since it would not expose you to the latest convective weather planning tools. This is where using an app like ForeFlight or Garmin Pilot can significantly improve your briefing, whether you perform it entirely on your own or use some of the extra weather resources to supplement a Flight Service briefing.
Long-range planning
One of the main appeals of general aviation flying is the flexibility it provides, and flexibility is the name of the game when dealing with convective weather. For this reason, getting a feel for the weather forecast several days out can help you to start thinking about the best time for departure and a storm-free route. While the cooler mornings traditionally offer convection-free air, a strong cold front or low-pressure system can spark strong storms at any hour of the day.
To get started, let’s look at some of the advanced weather charts in the Imagery section of ForeFlight.
Prog Charts – regardless of the mission or potential weather hazards, always start with the prog chart in advance (and current surface analysis the day of the flight) to identify the drivers of the weather pattern, including locations of highs, lows and fronts. The red cross-hatching shown in this example indicates a chance of thunderstorms in that area.

12-Hour Probability of Precipitation (PoP) – This long-range, model-based forecast product is issued from 3 to 7 days out, and identifies the probability in percentages and color-shading of where precipitation is forecast over a 12-hour period. While it doesn’t specifically forecast thunderstorms, you can assume the rain is likely from the result of storms if it’s showing high probabilities in the south when the forecast temperatures are high, or if the precipitation is along a strong cold front.

6-Hour Quantity of Precipitation – This is also a model-based forecast, meaning it’s generated by computers based on current weather trends. This displays the quantity of precipitation expected to fall over a 6-hour period, out to 84 hours in the future. Like the PoP chart, it doesn’t specifically forecast thunderstorms, but you can infer their development if heavy rainfall is forecast along a front or in a region with a warm air mass.

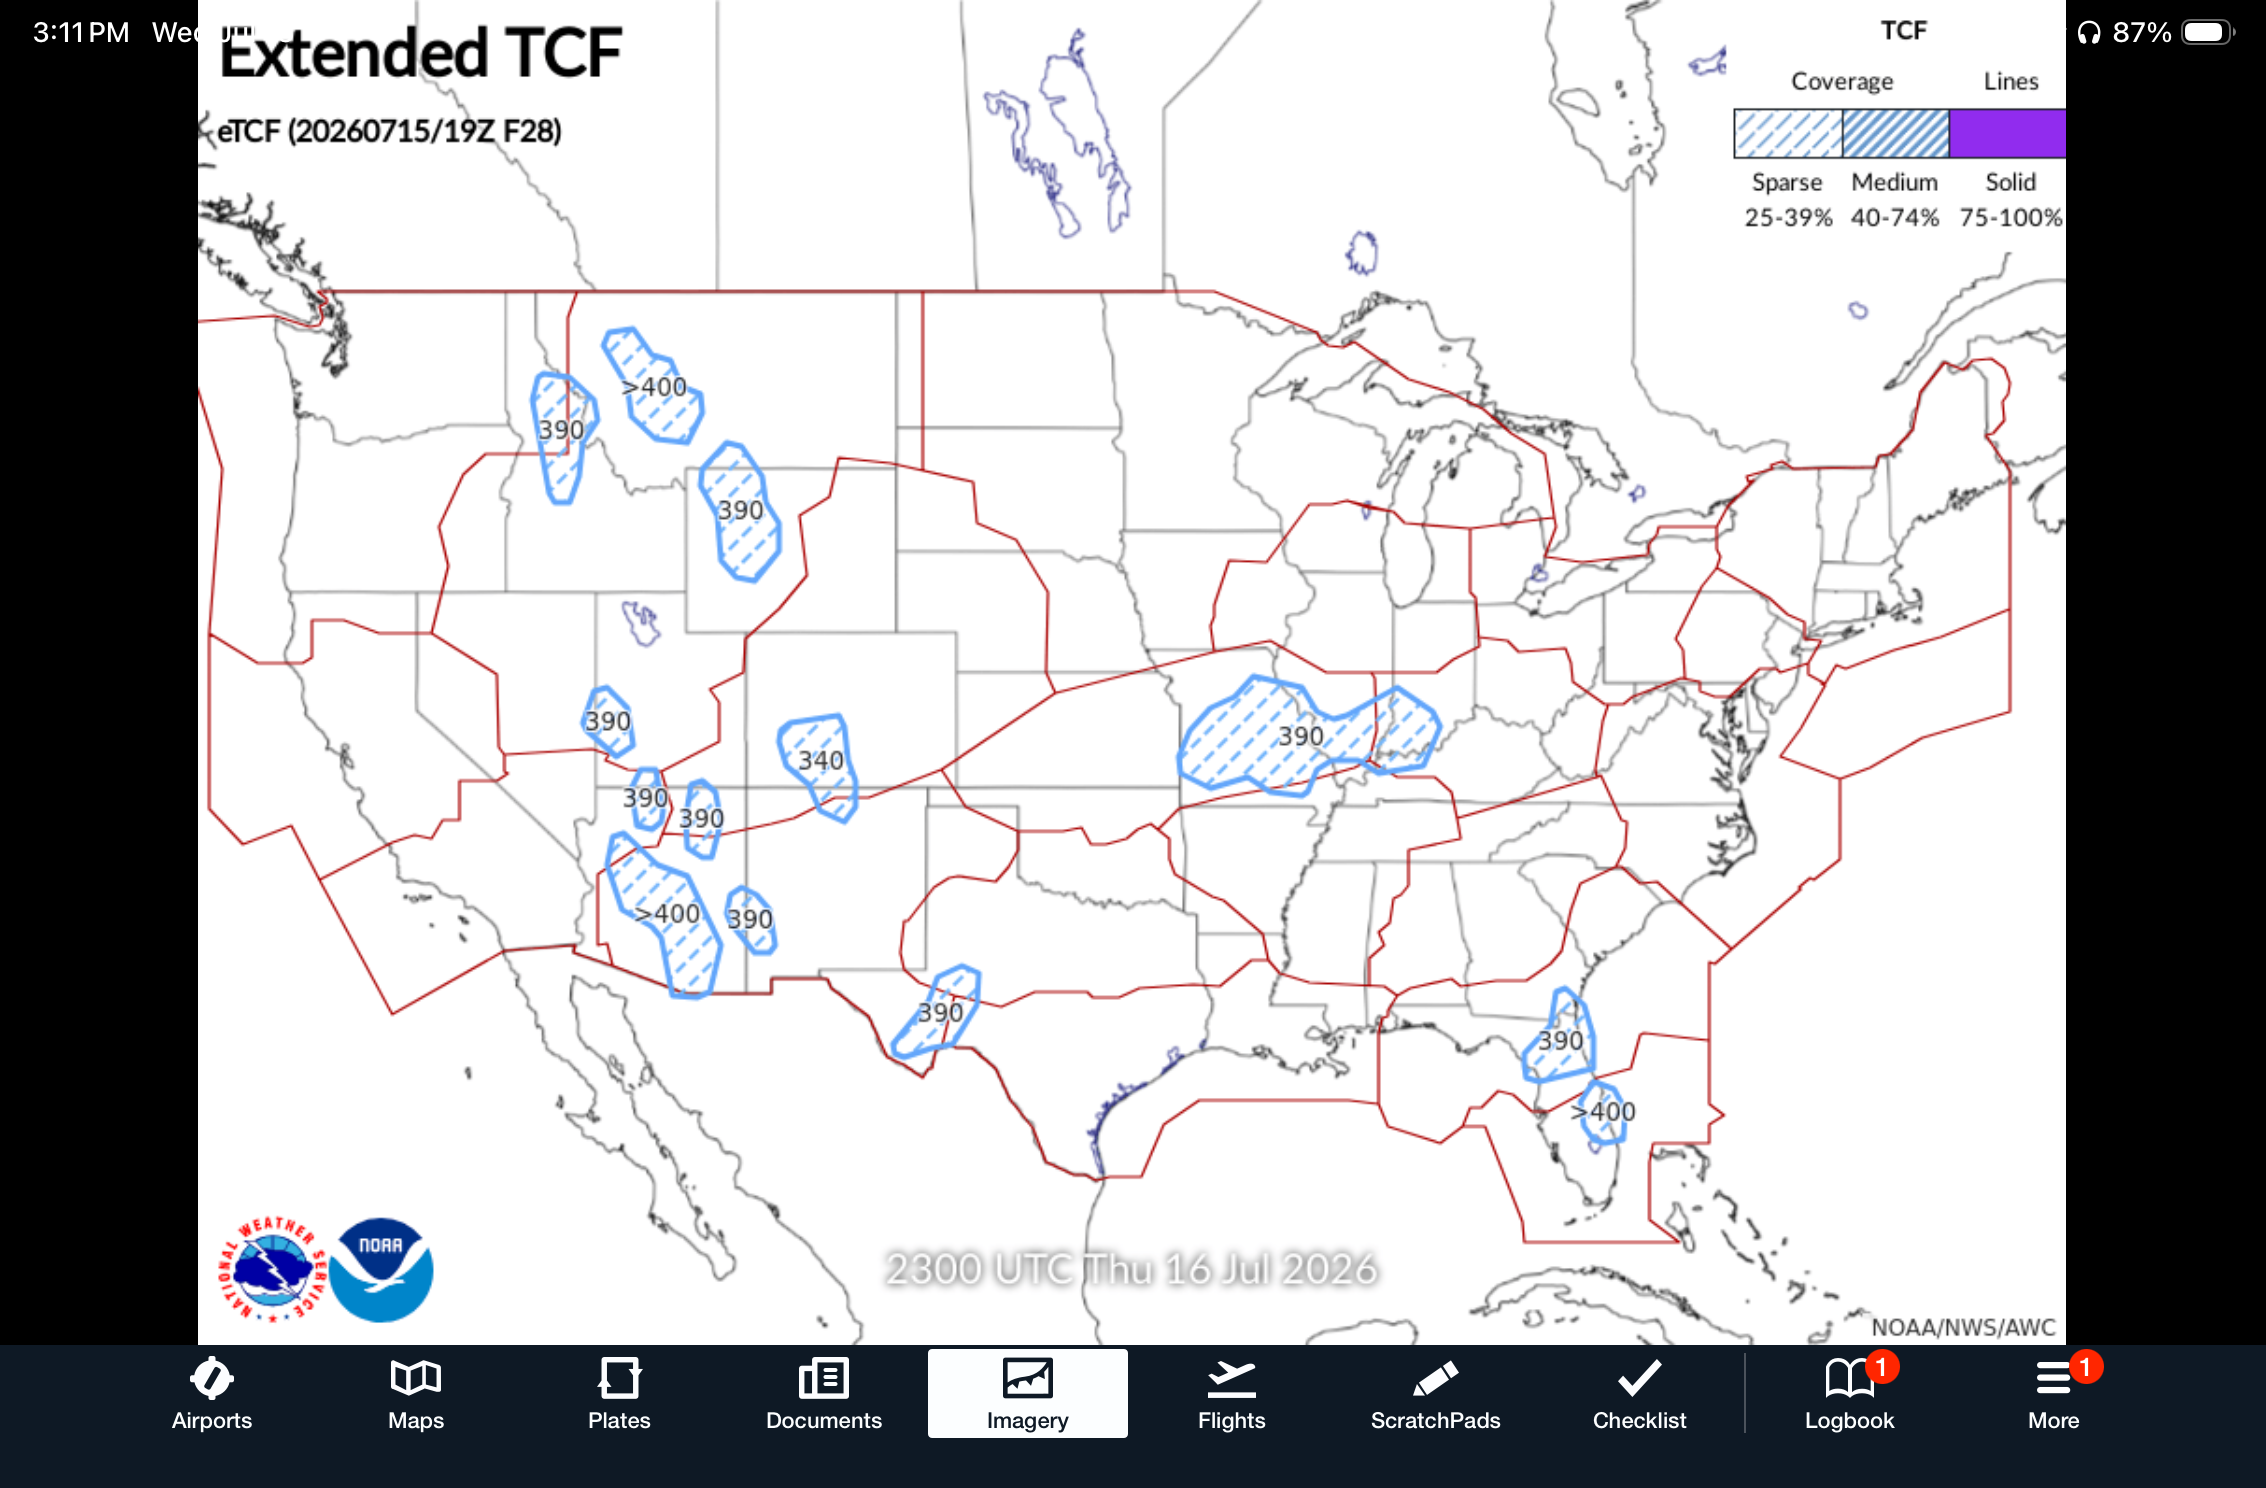
Extended Traffic Flow Management (TFM) Convective Forecast – This automated forecast product was designed to provide ATC managers, flight planners, and other groups supporting FAA operations with an indication of where weather-related traffic constraints are likely to be concentrated at a given time. It is available from 10 to 30 hours in advance and provides forecast windows in 2-hour intervals. Expected convective coverage is depicted with hashed markings, lines, and solid shading. You can expect areas of significant convection in the highlighted areas, with returns of 40 dBZ or higher reflectivity and cloud tops above FL250.
Storm Prediction Center (SPC) Convective Outlook – This resource is primarily focused on identifying areas where thunderstorms will develop, and specifically their potential for severe conditions for the next 3 days. Light green identifies general thunderstorm activity, and then there are 5 levels with somewhat misleading descriptions (marginal, slight, enhanced, moderate, high) with intensifying color shading to identify the level of forecast severity.

TAF and Forecast Discussion – The traditional TAF forecast product is helpful for thunderstorm forecasts at the departure or destination airport, as well as for airports along your route, as identified by TS (thunderstorm) in one of the time periods. The text formatting of a TAF is limited though and doesn’t really tell the full story about the “why” behind the forecast. This is where the Forecast Discussion comes in handy and provides additional insight into what’s causing the weather, forecast confidence, and more details on the timing of storms in the forecast period. When viewing a TAF in ForeFlight, the Forecast Discussion button can be found directly beneath the raw TAF text.

Short-term planning
When making final preparations for a flight where convective activity is forecast, the place to start is still the Surface Analysis, to identify the latest large-scale weather features. After reviewing the updated TAFs and Forecast Discussion, we recommend using several short-range planning tools found in the Imagery section and on the interactive map:
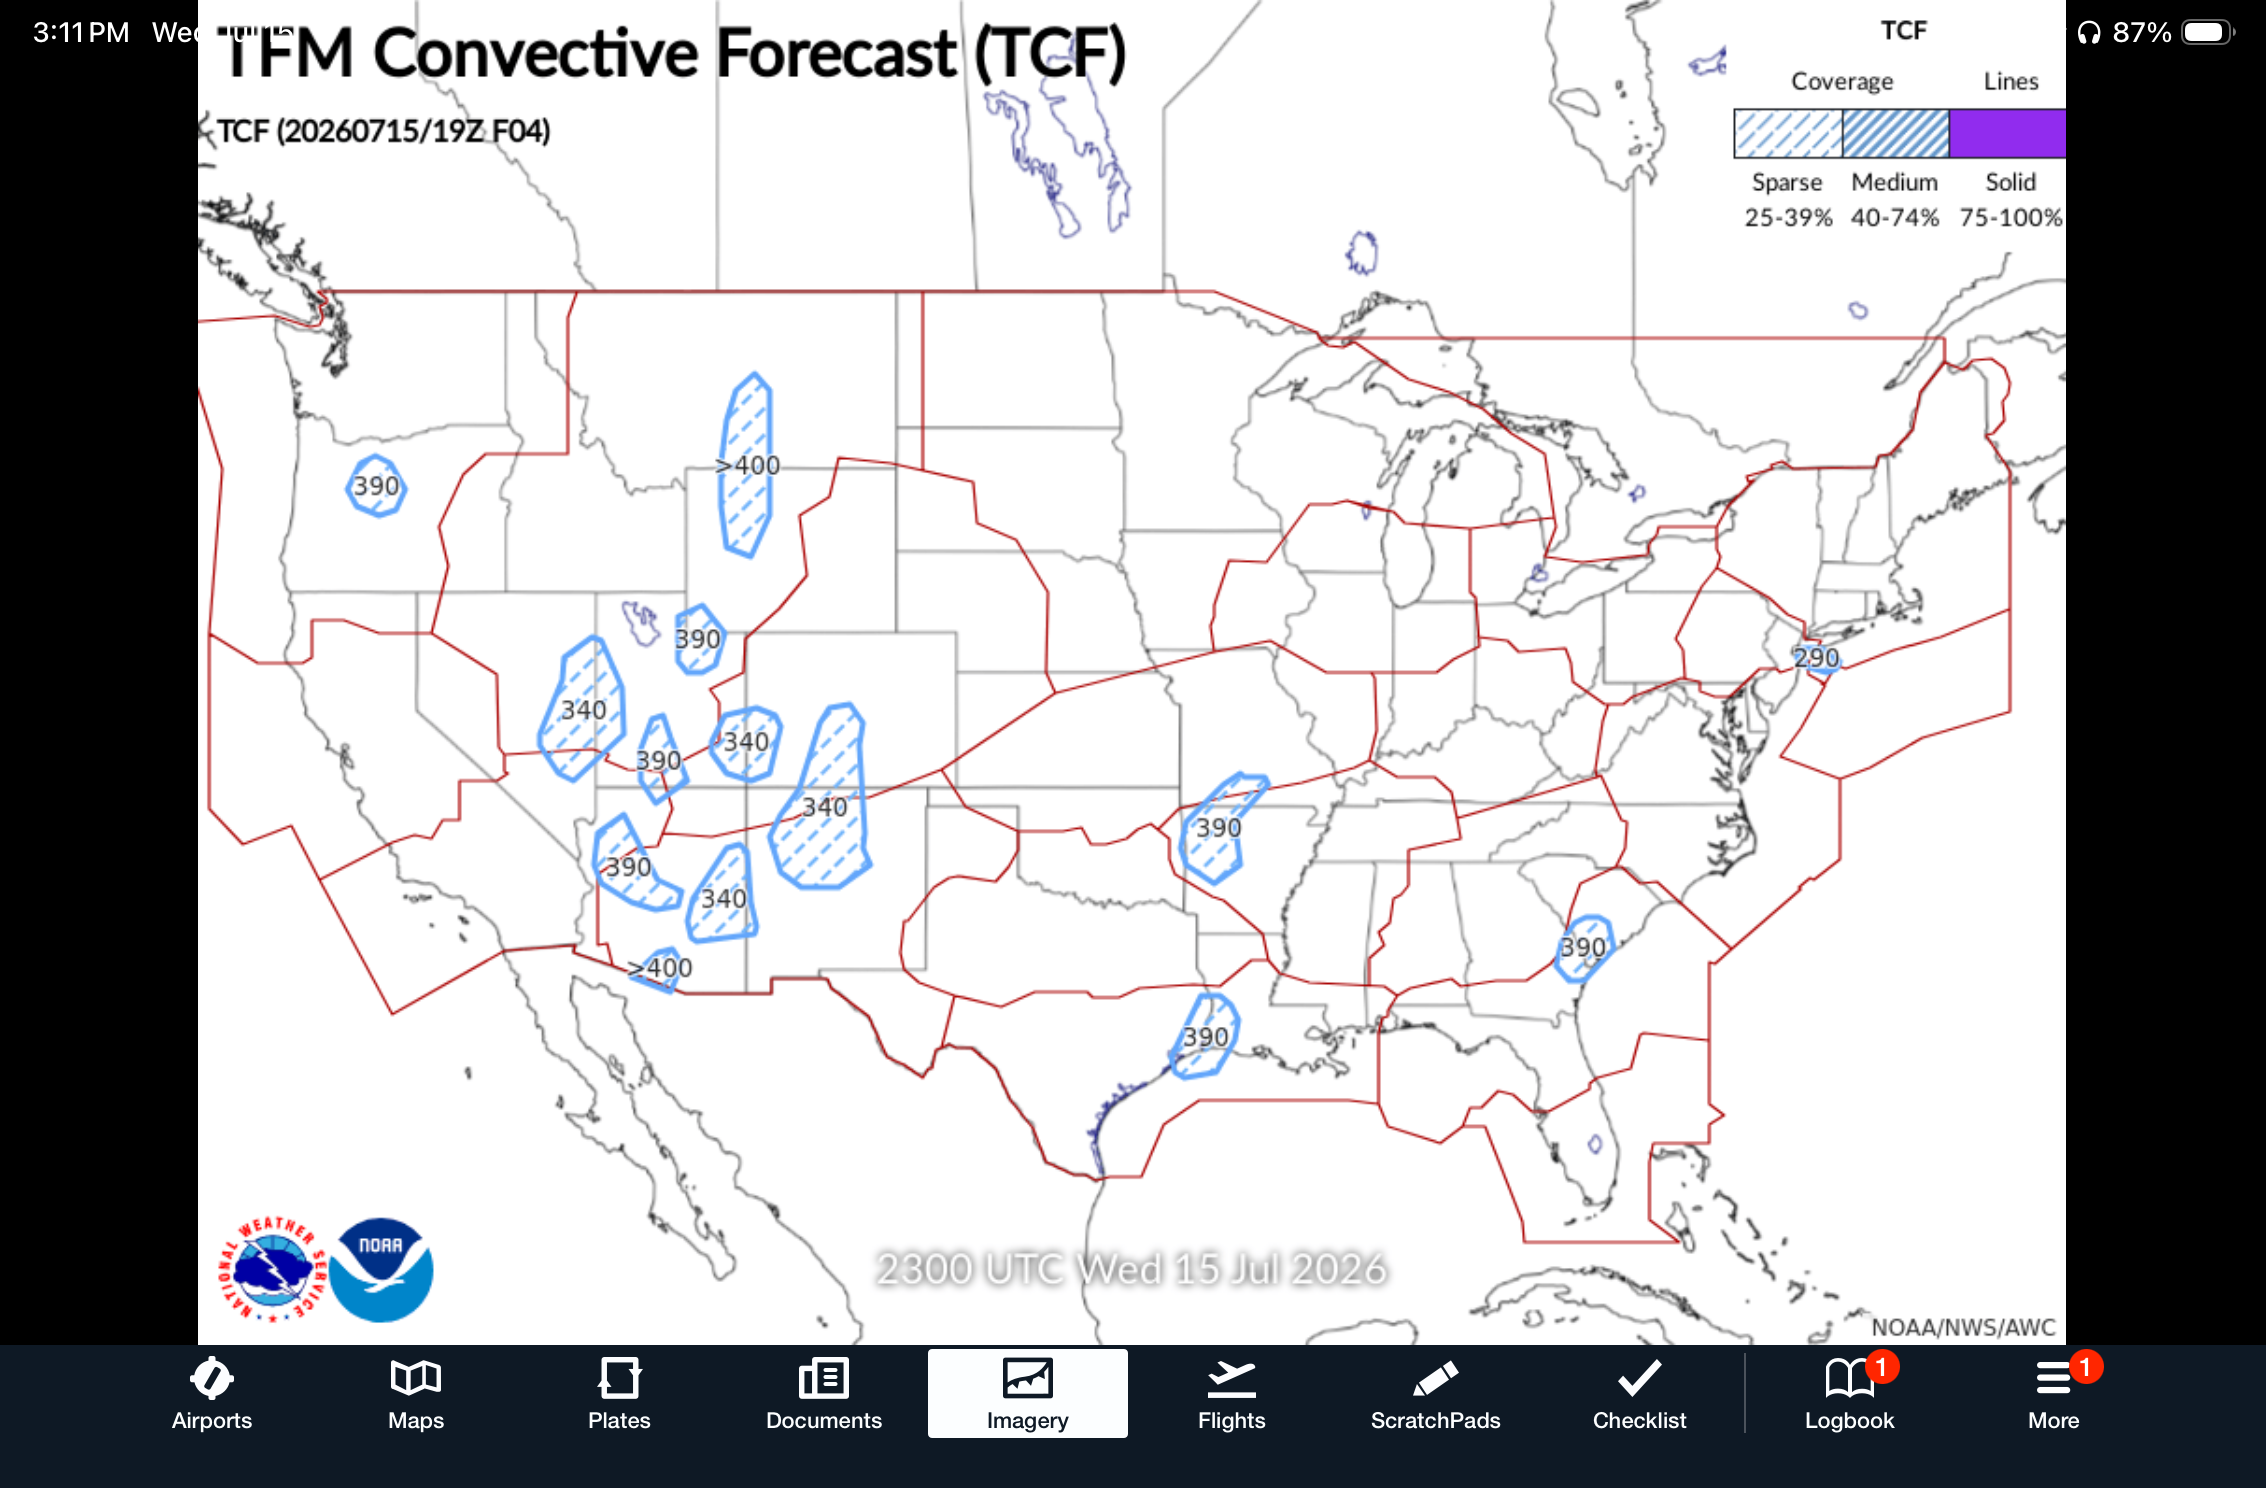
Traffic Flow Management (TFM) Convective Forecast – At first glance, the TFM product appears very similar to the extended TFM convective product discussed earlier, but it differs in several ways. First, it is a short-range forecast intended for the upcoming 8 hours. Second, it is created by a meteorologist (vs. an automated model) and is a high-confidence forecast for convection meeting specific criteria.
Convective SIGMETs vs. Center Weather Advisories – We all learned about the importance and meaning of Convective SIGMETs in primary training, which defines areas of active thunderstorms. They were initially developed as a text forecast, but the common way to view them now is graphically on a map. When on the Maps screen in ForeFlight, enable the AIR/SIGMETS/CWA layer, and ensure the blue TS (Thunderstorm) button is turned on at the bottom of the screen. Red outlines identify Convective SIGMETs, and if you turn on the Radar layer, you’ll see they surround active thunderstorm lines or cells. Tap on one to determine the storm tops and speed/direction of movement.

With the TS layer enabled, you will see that ForeFlight also outlines current Center Weather Advisories in yellow. This regional guidance identifies areas where convective activity is likely to develop over a specific time period and can help you with route planning. This is a short-term, highly localized warning issued by Center Weather Service Unit (CWSU) meteorologists at an ARTCC (Air Route Traffic Control Center) for conditions currently impacting or approaching the airspace. These are much more granular and specific to a small area, whereas Convective Sigmets are issued for severe or widespread thunderstorm activity.
Radar and Lightning – The radar layer provides the best view of what is actually happening and offers last-minute guidance on route selection and a heading to fly out of the terminal environment when convective activity is present. When viewing radar imagery on any system, always glance at the dBZ scale to identify the color shading of intensity levels (turn this on in the main Settings menu if it’s not showing), and make sure the time stamp is up to date at the top left of the screen (tap it for more details). You’ll also want to animate the radar using the play button at the bottom of the screen to visually observe movement and intensity trends.

ForeFlight also includes a separate lightning layer that should be enabled to help identify rapidly building storms that aren’t being painted with red or magenta levels yet. The lightning layer only shows cloud-to-ground strikes, which can also be used to identify lightning threats in embedded storm systems with weaker gradients that might look ok to fly through based on the dBZ intensity (green or yellow) but still contain active lightning strikes.
After departure and when an internet connection is no longer available, it’s time to take advantage of an ADS-B receiver like Sentry to stay updated with thunderstorm developments en route. From a thunderstorm-avoidance standpoint, this will provide radar updates every 2.5 minutes, as well as lightning information from a separate layer. Check out this informative webinar for more information on effectively using ADS-B datalink weather in flight.


- Quiz: What do these aviation iPad app acronyms mean? - October 6, 2026
- How to retrieve a Mobile IFR Clearance using Garmin Pilot - September 30, 2026
- iOS Update Green Light program: iOS and iPadOS 27.0.1 - September 28, 2026


Great article Bret. Thank you. This year marks 61 years of flying for me and to witness the tools available today from 60 years ago is amazing