
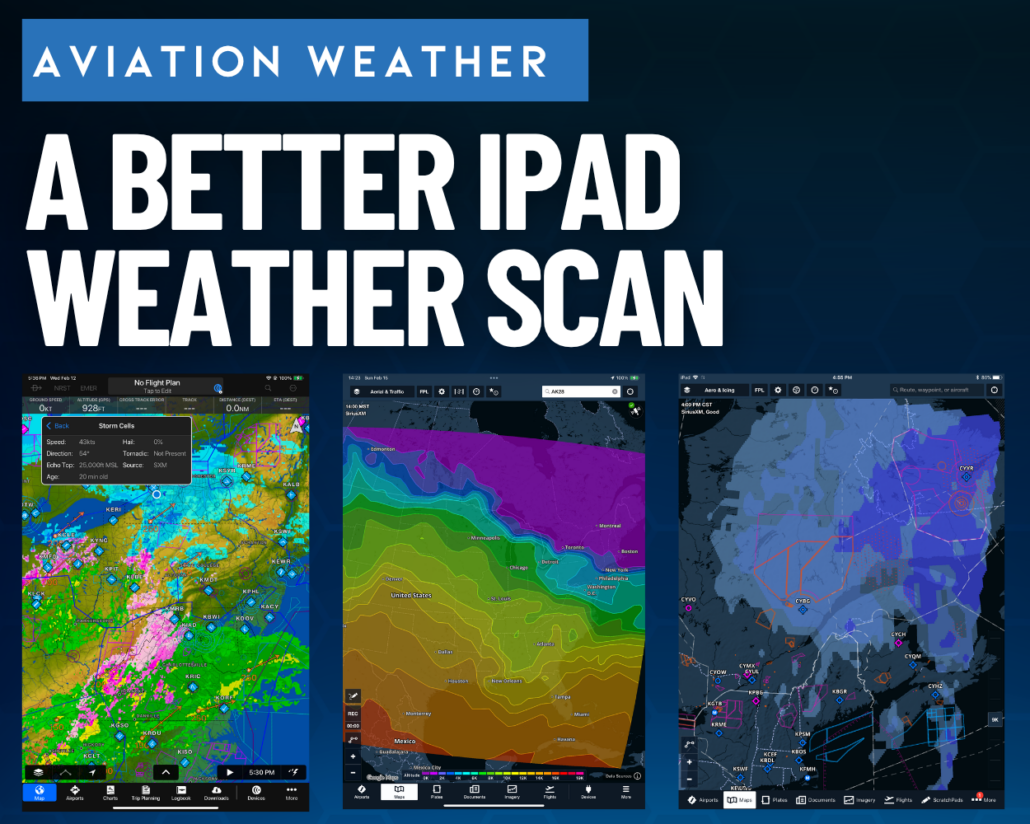
Build Your Weather Scan with SiriusXM Aviation Weather on Your iPad
Editor’s note: This article was authored by Sean Siff of SiriusXM Aviation. iPad Pilot News occasionally publishes contributed content from industry partners when we believe it offers valuable information for our readership.
 A Bigger Weather Picture
One of the greatest benefits of SiriusXM Aviation Weather is the ability to see weather well beyond the immediate vicinity of the aircraft, giving pilots an opportunity to understand how the larger weather picture may be affecting the local conditions they’re seeing out the windscreen. Weather systems developing ahead of a flight can affect the selected route, cruise altitude, destination, and alternate airports. SiriusXM Aviation Weather provides a broad collection of weather products that can help define that bigger picture in greater detail.
One way to get the most out of that information is to develop a weather scan, much like a basic instrument scan. Below, I’ll recommend a mix of graphical weather layers and text-based products worth evaluating on ForeFlight or Garmin Pilot while in flight. Using multiple sources can improve situational awareness and help pilots make informed decisions with the most up-to-date weather information available in the air.
High-Resolution Composite NEXRAD Radar
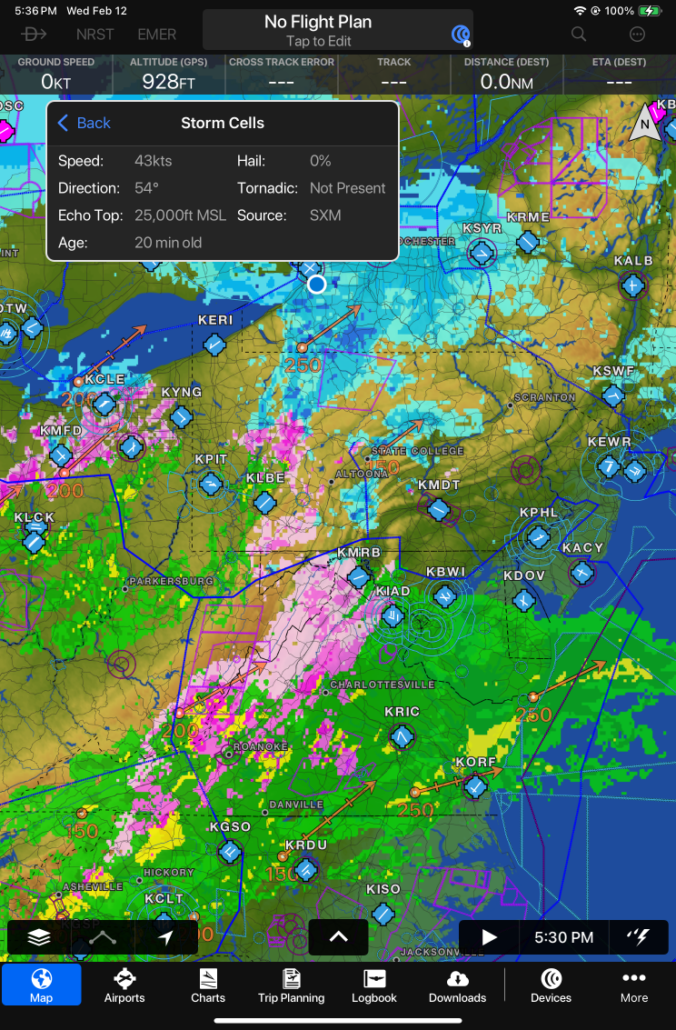
Over the years, many pilots have come to associate SiriusXM Aviation Weather with its high-resolution composite NEXRAD radar feed. Updated every 2.5 minutes, this radar picture covers the entire contiguous United States. It’s called a composite radar return because it is built from multiple radar elevation scans to display the strongest precipitation detected in a vertical column of convective weather. Because this is a high-resolution feed, a pilot can zoom into a radar return for a detailed look at a specific storm cell. Looping previously received radar images can help identify the direction and trend of storm movement and precipitation intensity. Add storm cell attributes, which update every five minutes, and lightning information, which updates every 2.5 minutes, and pilots can build a more complete picture of a storm even when they’re still a few hundred miles away.
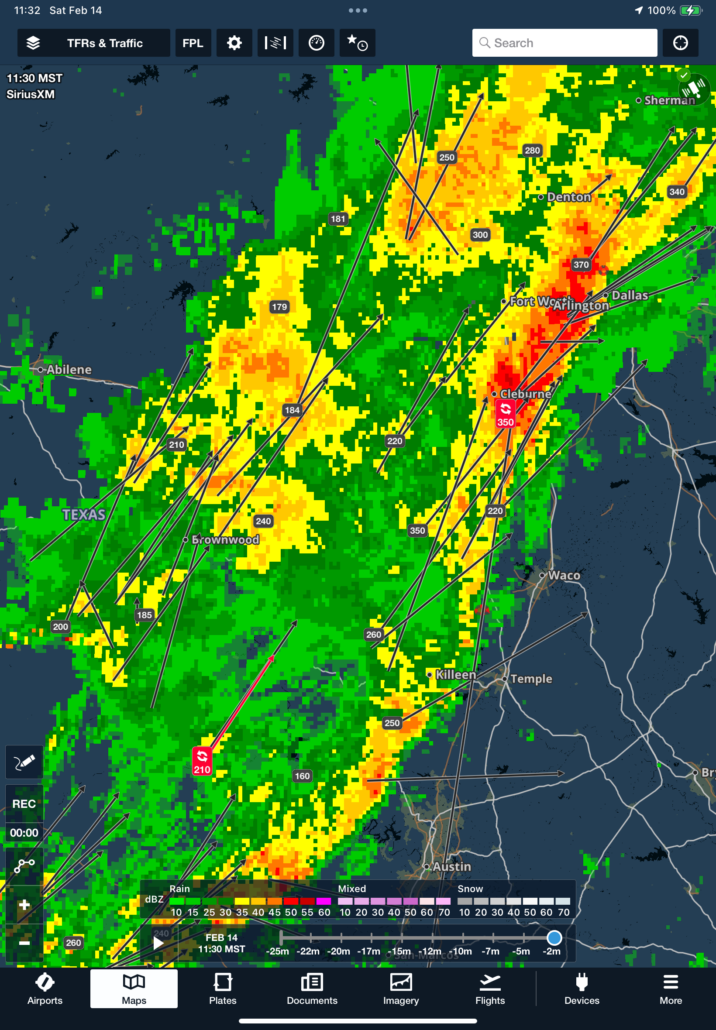
The goal of this information is to supplement what the pilot sees outside the airplane or what is displayed on an onboard radar, if the airplane is so equipped. It can also help pilots look beyond a storm system and see what may be developing farther along their route.
There are other critical weather layers available by selecting the appropriate overlay in either ForeFlight or Garmin Pilot. I recommend incorporating some of these layers into your scan, as there’s much more to the SiriusXM Aviation Weather service than radar alone.
Use radar to understand the trend, not just the current picture.
Icing NOWcast and Freezing Level
With the start of the fall flying season and winter not far behind, the SiriusXM Icing NOWcast weather layer can be useful before and during a flight. It provides a graphical depiction of areas where atmospheric conditions indicate current icing potential in terms of probability. Unlike a longer-range icing forecast, the emphasis is on present atmospheric conditions. Depicted graphically over the moving-map display, this weather product covers altitudes from 0 to 24,000 feet, making it a useful weather tool for many single- and multiengine piston pilots.
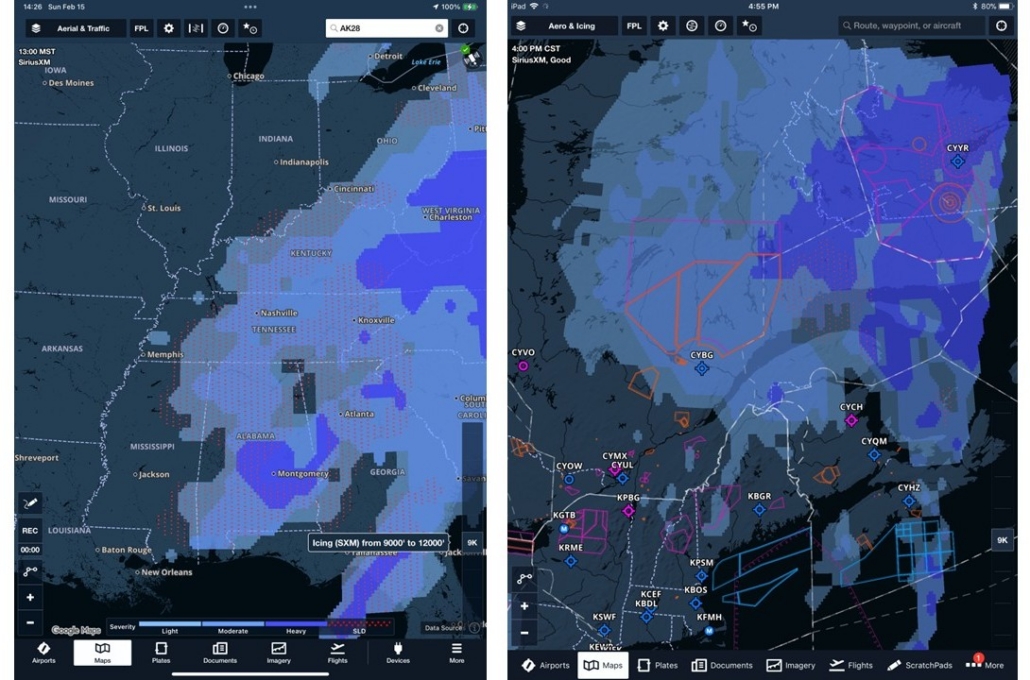
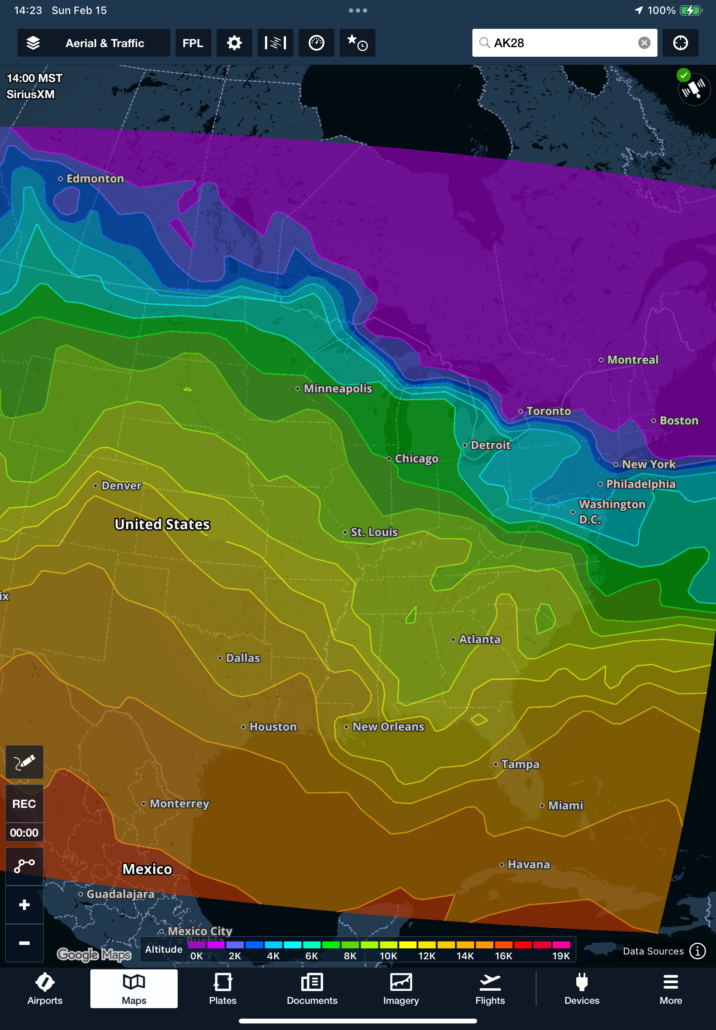
As a visual product, it’s quick to interpret. Icing severity and the potential for Supercooled Large Droplets (SLD) are displayed graphically, allowing pilots to incorporate the information into their overall weather scan. The layer is updated every 15 minutes. Once you’ve evaluated icing conditions, you can get a region- or country-wide view of freezing levels to help with your choice of cruising altitude. Color-coded bands indicate the altitude where freezing air temperatures exist, allowing you to zoom in on your route of flight and quickly interpret this information.
Graphical Turbulence Guidance and PIREPs
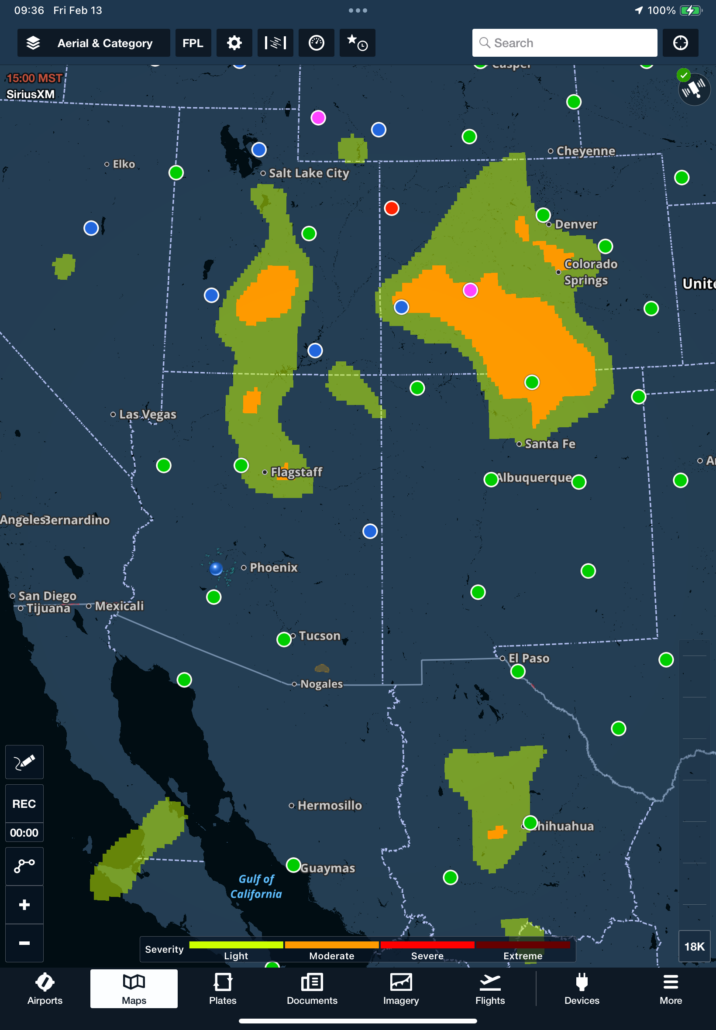
No matter what flying season it is, pilots are always looking for a smooth ride. Like Icing NOWcast, Graphical Turbulence Guidance is displayed visually on the map to help guide route selection by showing a forecast of expected turbulence severity. Updated every 30 minutes, it’s another quick and easy-to-interpret weather overlay to add to your in-flight weather scan.
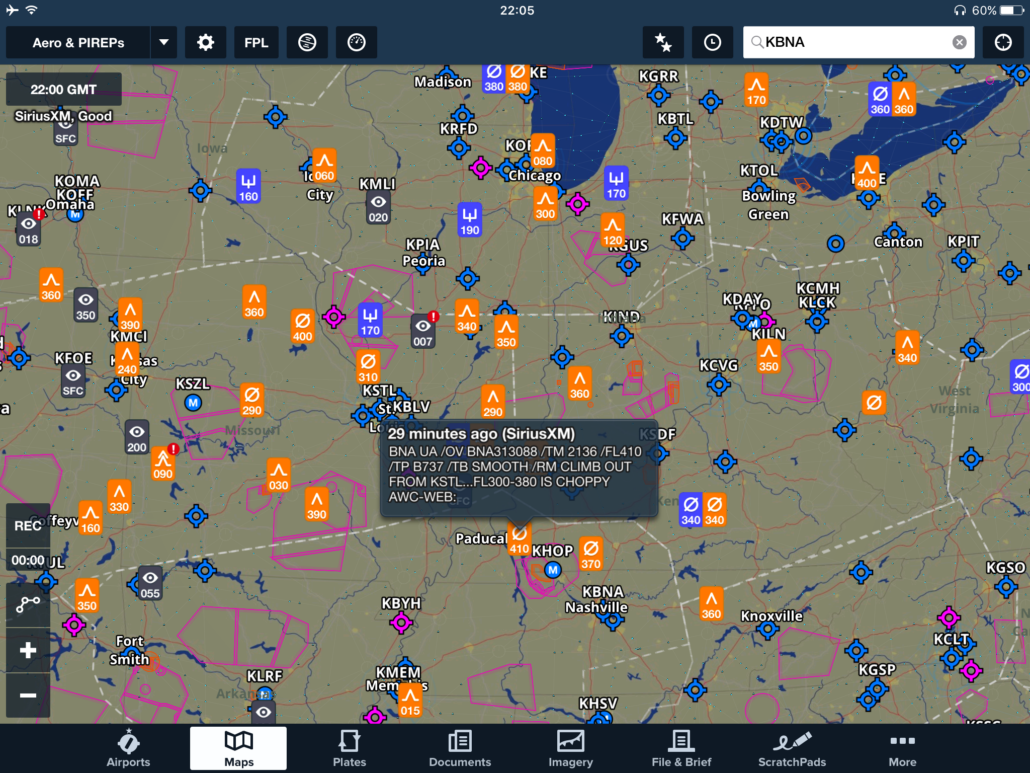
If you need more immediate turbulence or en route weather information, PIREPs are updated every 15 minutes for the entire continental United States. Zooming in on your route of flight will show the PIREPs reported in your vicinity. The specific PIREP symbol identifies the type of information reported in both ForeFlight and Garmin Pilot.
METARs and TAFs
Some of the most valuable weather information in the SiriusXM Aviation Weather feed is text-based. Clicking on an airport in ForeFlight or Garmin Pilot will bring up additional information about the airport, including the latest METAR and TAF, where available. This information is time-stamped so you can see how old it is, and the feed is updated every 10 minutes.
If you use ForeFlight, one easy way to see weather conditions at a glance at airports along your route is to turn on the Flight Category overlay. This displays airports in green for VFR, blue for Marginal VFR, and red for IFR conditions. Clicking on any of the colored circles brings up the airport’s METAR and TAF, if applicable. Used in flight, this provides a quick way to evaluate a potential alternate airport, with more detailed information just one finger press away.
Weather Where You Already Work
Once you get comfortable with your weather scan, it’s easy to add more layers or change the layers you’re viewing to fit the season and the mission you’re flying. For example, a pilot approaching an area of deteriorating weather can look beyond a single radar image. METARs may show where ceilings and visibility are falling. TAFs can provide insight into expected conditions at airports farther along the route. PIREPs can offer observations from pilots already operating in the area, while AIRMETs and SIGMETs provide additional information about broader hazards.
Each individual product tells part of the story. Viewed together, they provide a much more complete picture. A pilot can begin evaluating weather before departure, then continue monitoring evolving conditions while airborne using the same familiar application and interface. Consider a flight of several hundred miles. Conditions at the departure airport may be excellent, but a frontal system could be moving across the destination several hours later. With SiriusXM weather displayed on the iPad, the pilot can monitor how that system is developing while simultaneously evaluating destination and alternate airport conditions.
Good aeronautical decision-making rarely comes from a single piece of information. It comes from recognizing trends, comparing multiple weather overlays, and understanding how conditions are changing over time. Adding SiriusXM Aviation Weather brings satellite-delivered weather information to your iPad, giving pilots additional context for route-selection decisions—from the initial go/no-go decision to route changes, fuel stops, alternate planning, and the decision to divert when conditions don’t develop as expected.
The objective isn’t to use technology to get closer to hazardous weather. It’s to use better information to make decisions earlier and stay farther away from it. With SiriusXM Aviation Weather running on your EFB, your iPad can be a valuable source of strategic weather awareness. Developing a weather scan that combines multiple layers can help you make better use of the information available throughout the flight.
The goal isn’t to get closer to hazardous weather. It’s to make decisions earlier and stay farther away from it.

- Build Your Weather Scan with SiriusXM Aviation Weather on Your iPad - September 17, 2025

