
Garmin Pilot adds graphical NOTAMs to SmartCharts
Garmin debuted its innovative SmartCharts feature earlier this year, a fully interactive version of instrument approach charts and runway diagrams, accessible from the Garmin Pilot EFB app. In our first look at this feature, we did a deep dive to show how SmartCharts compare to FAA approach charts and improve the approach briefing process.
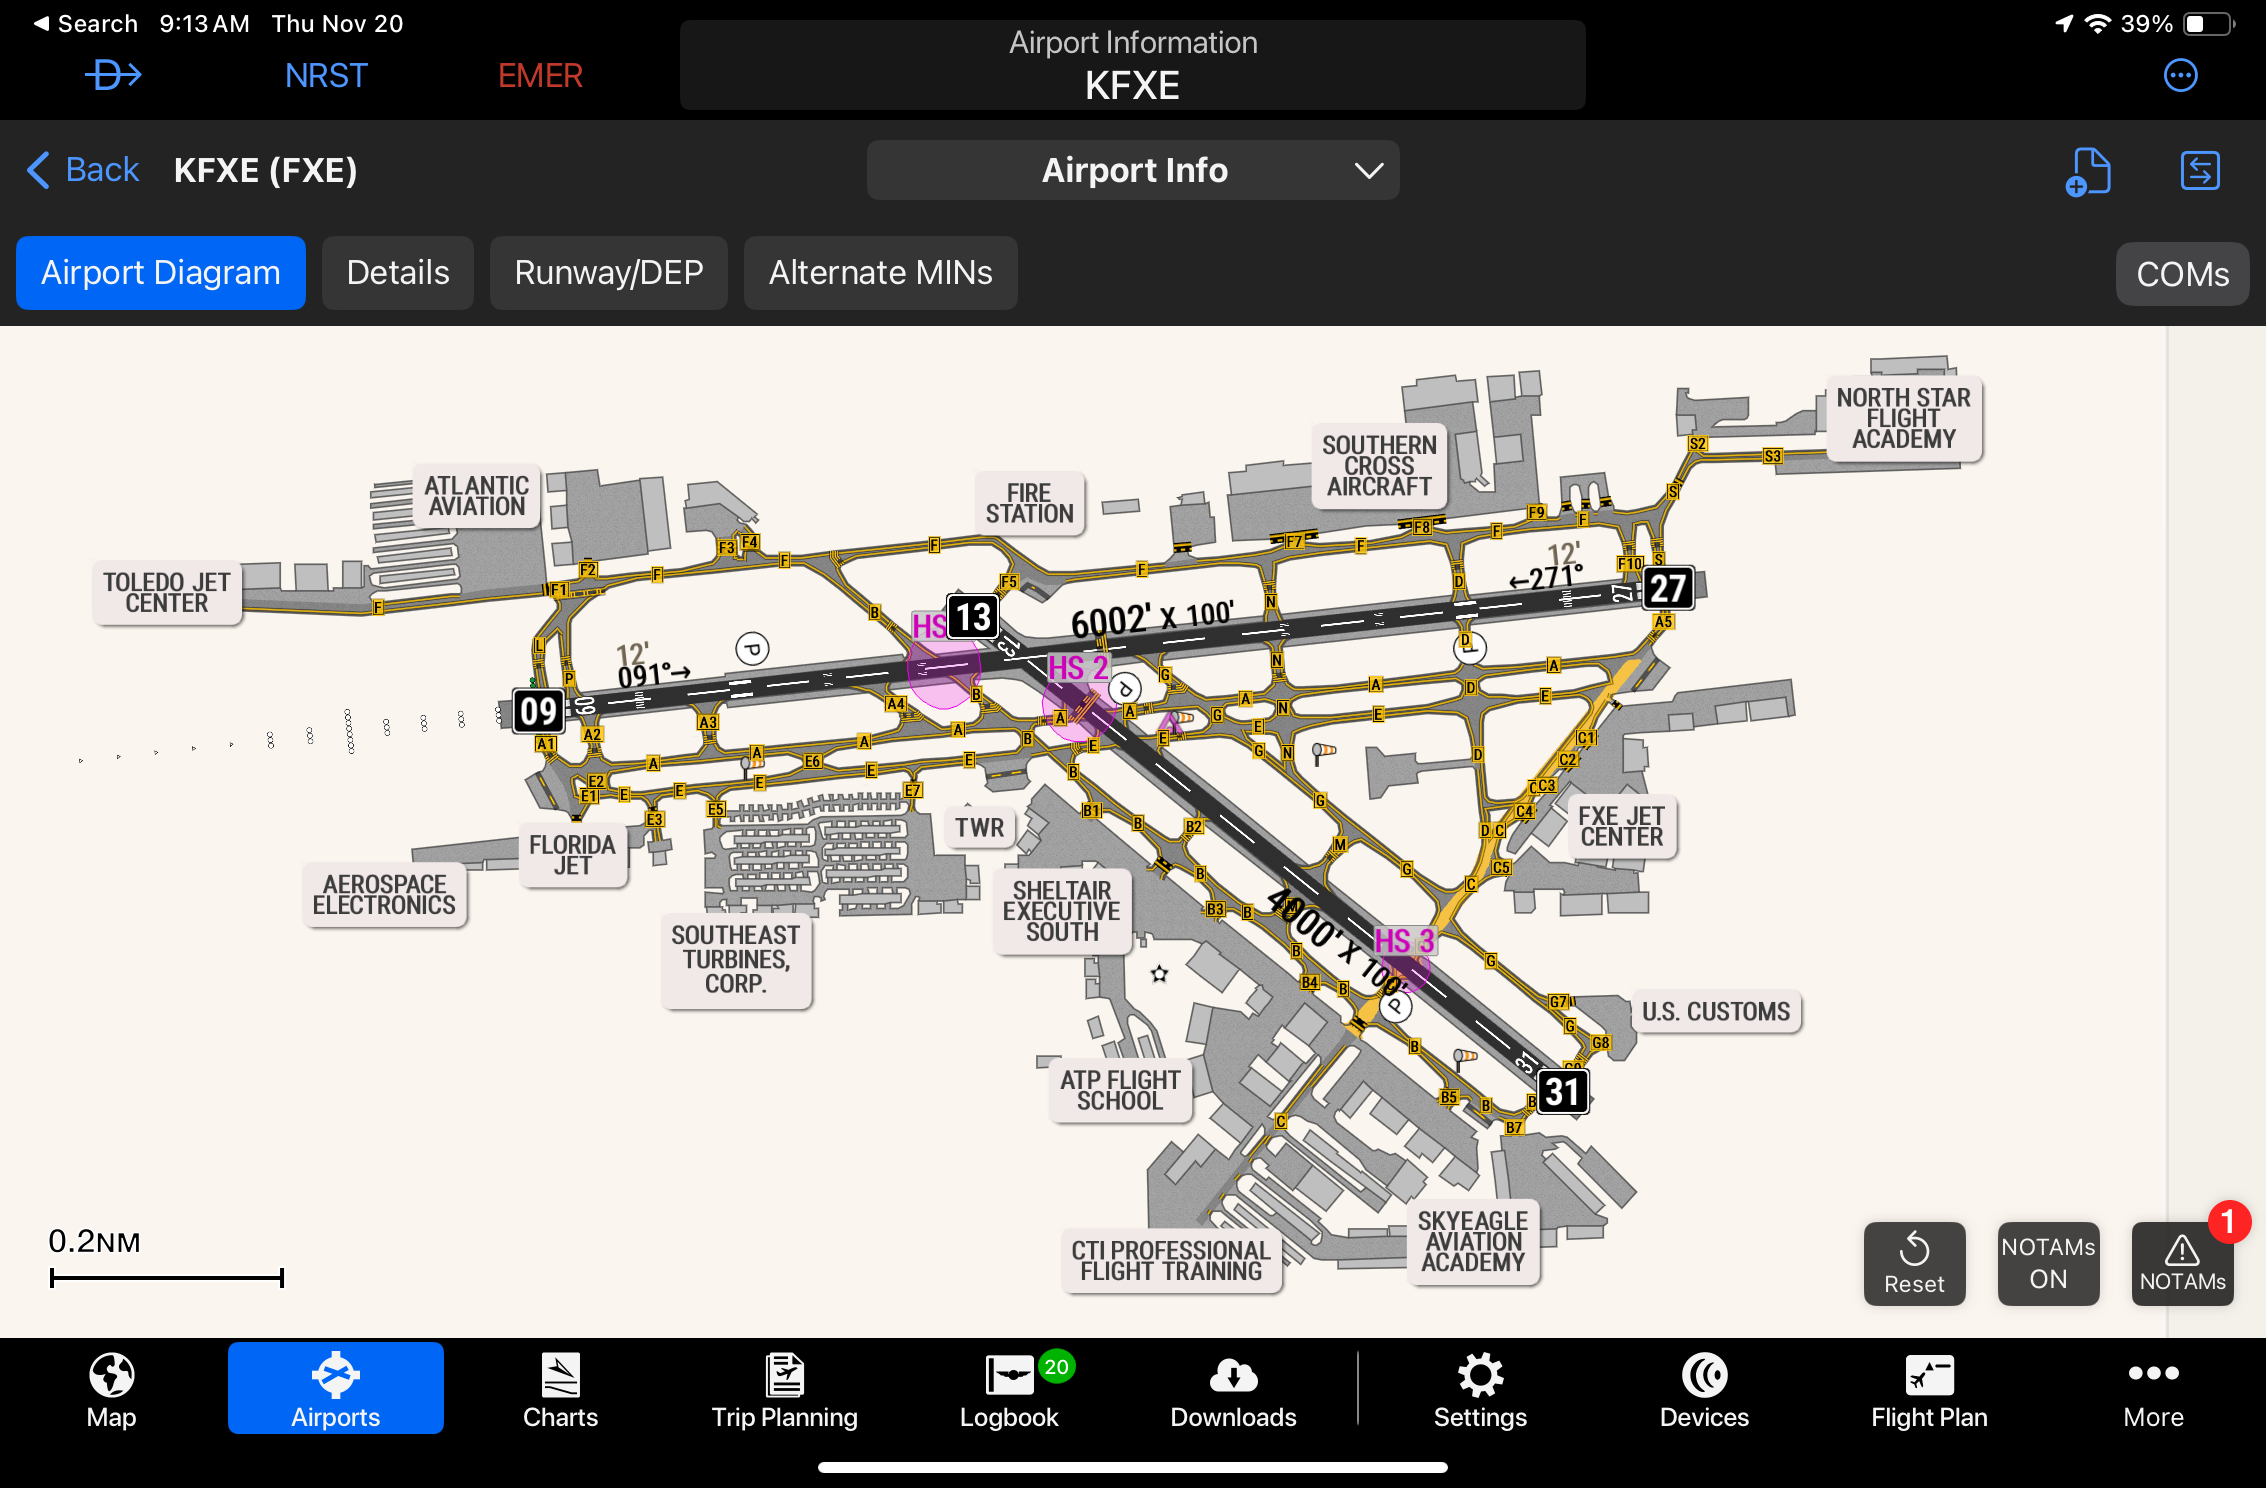
In addition to instrument approach charts, SmartCharts are also available for airport diagrams, which display a full-color airport runway and taxiway map, complete with depictions of lighting, signs, pavement markings, and more:
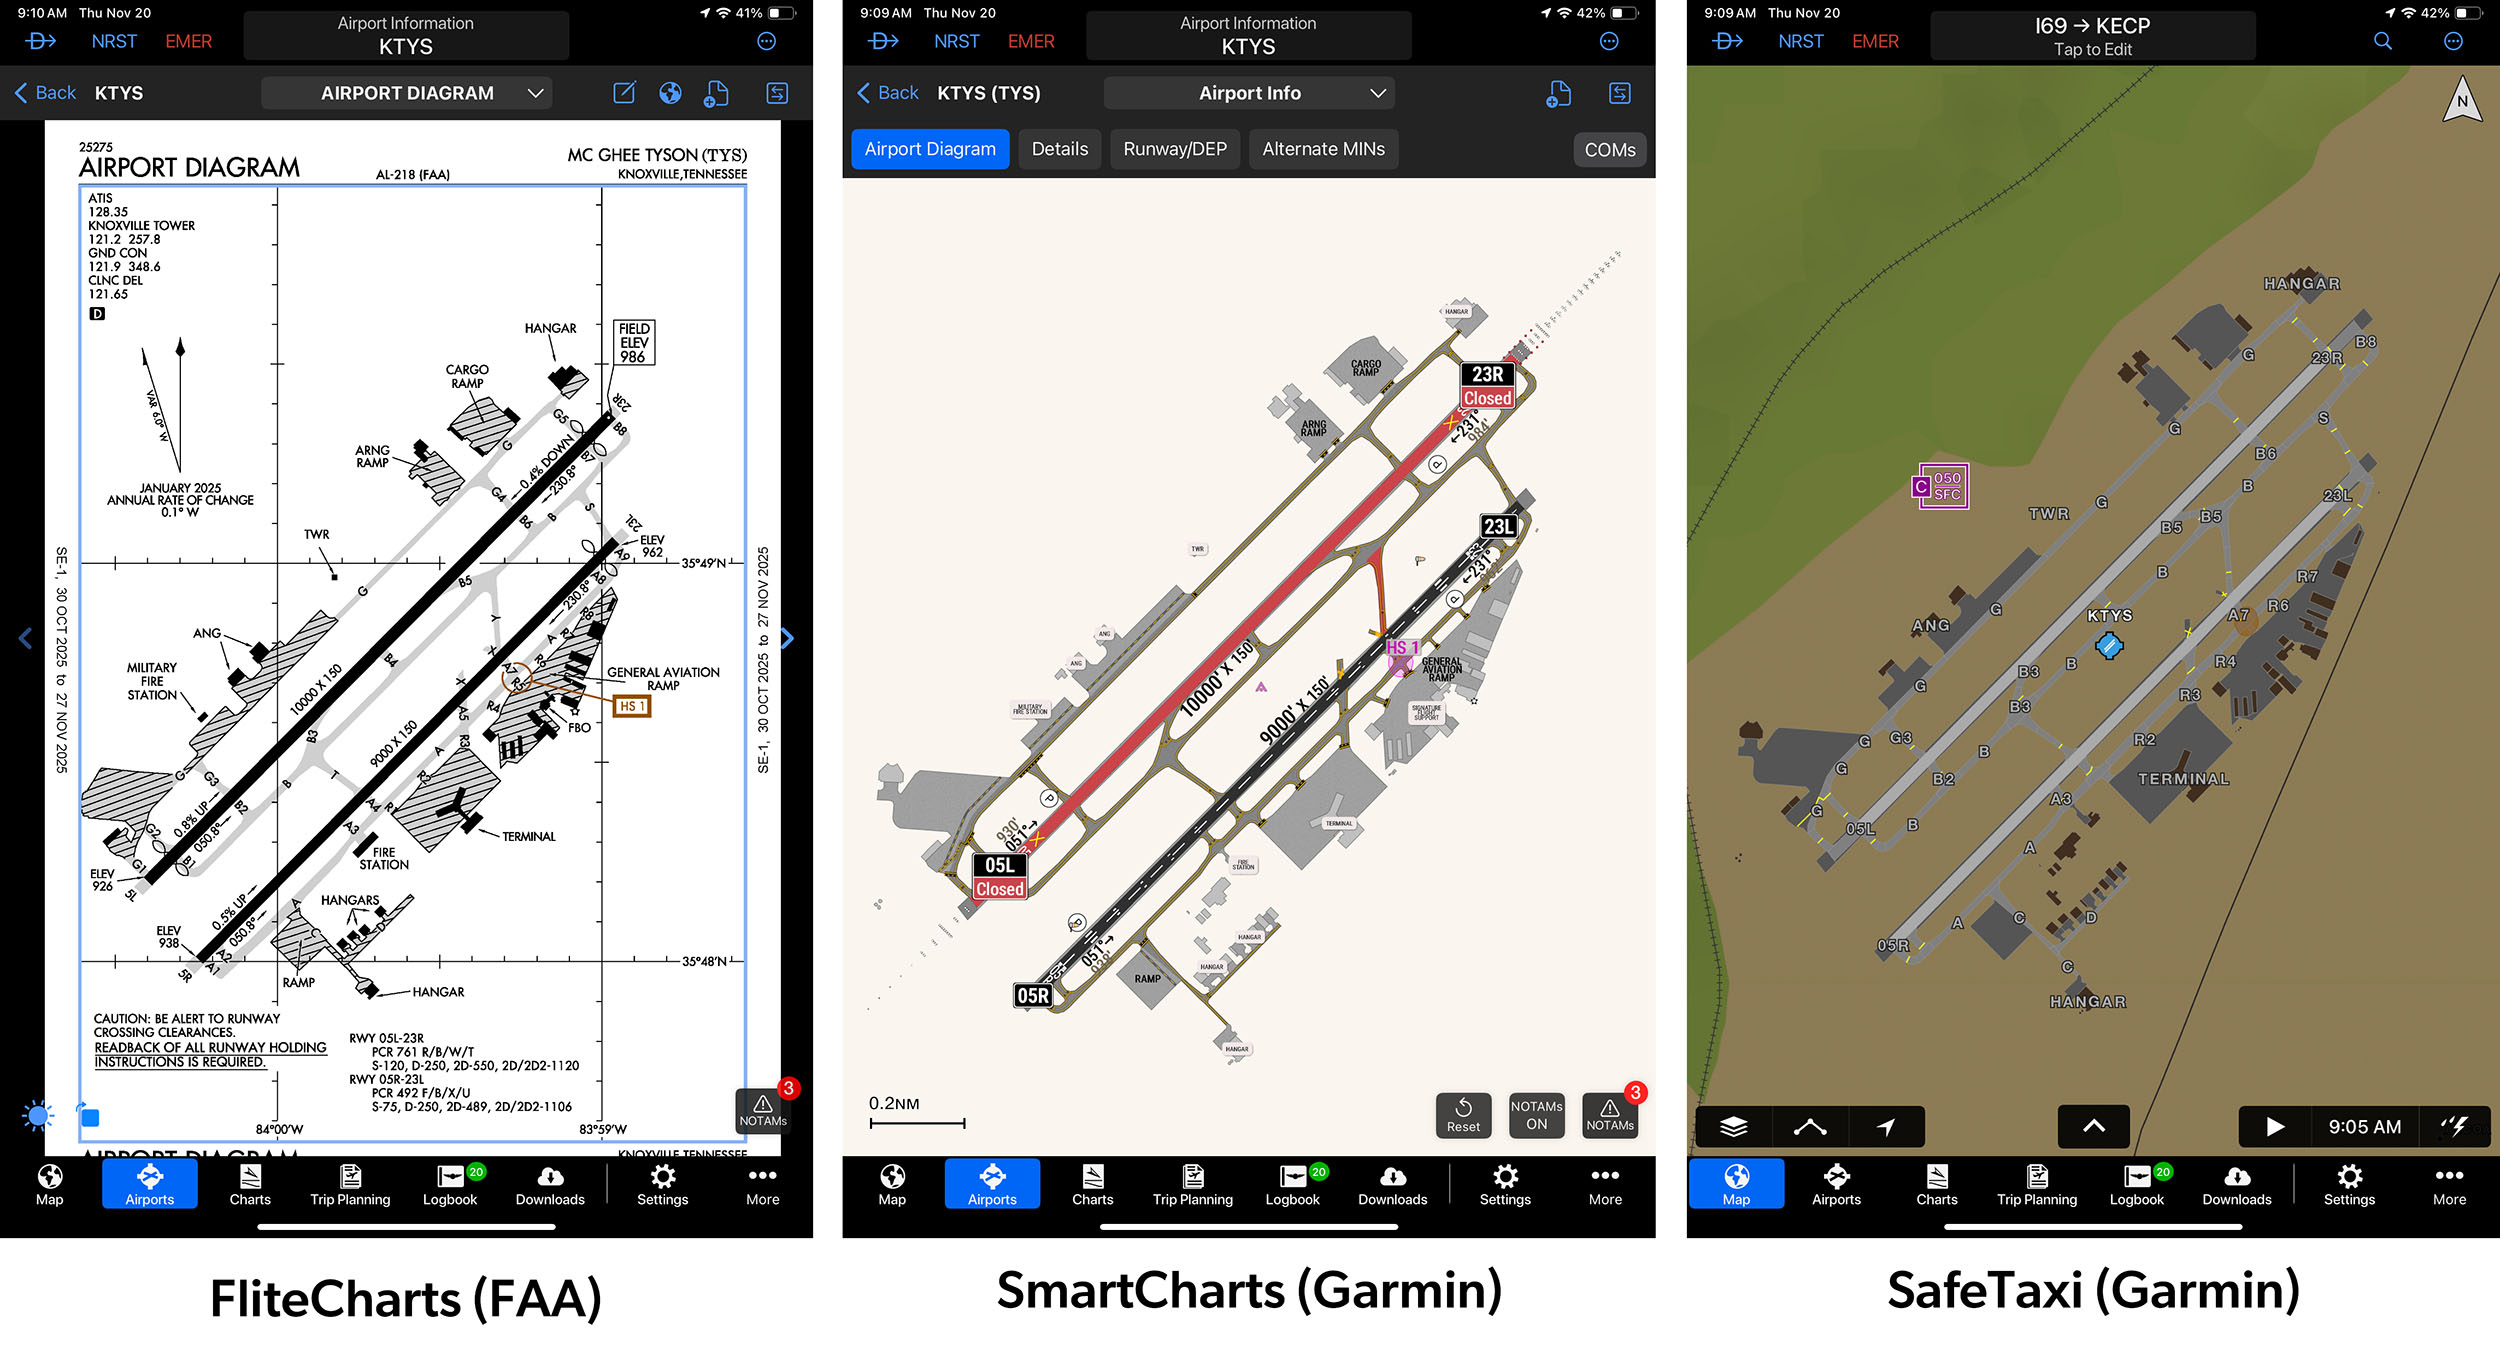
If you’re keeping track, that means that there are now three different versions of the Airport Diagram available in the Garmin Pilot app: the traditional black and white FAA version (Garmin calls these FliteCharts), the new SmartChart version, and the data-driven SafeTaxi version that appears when you zoom into an airport on the Maps screen:
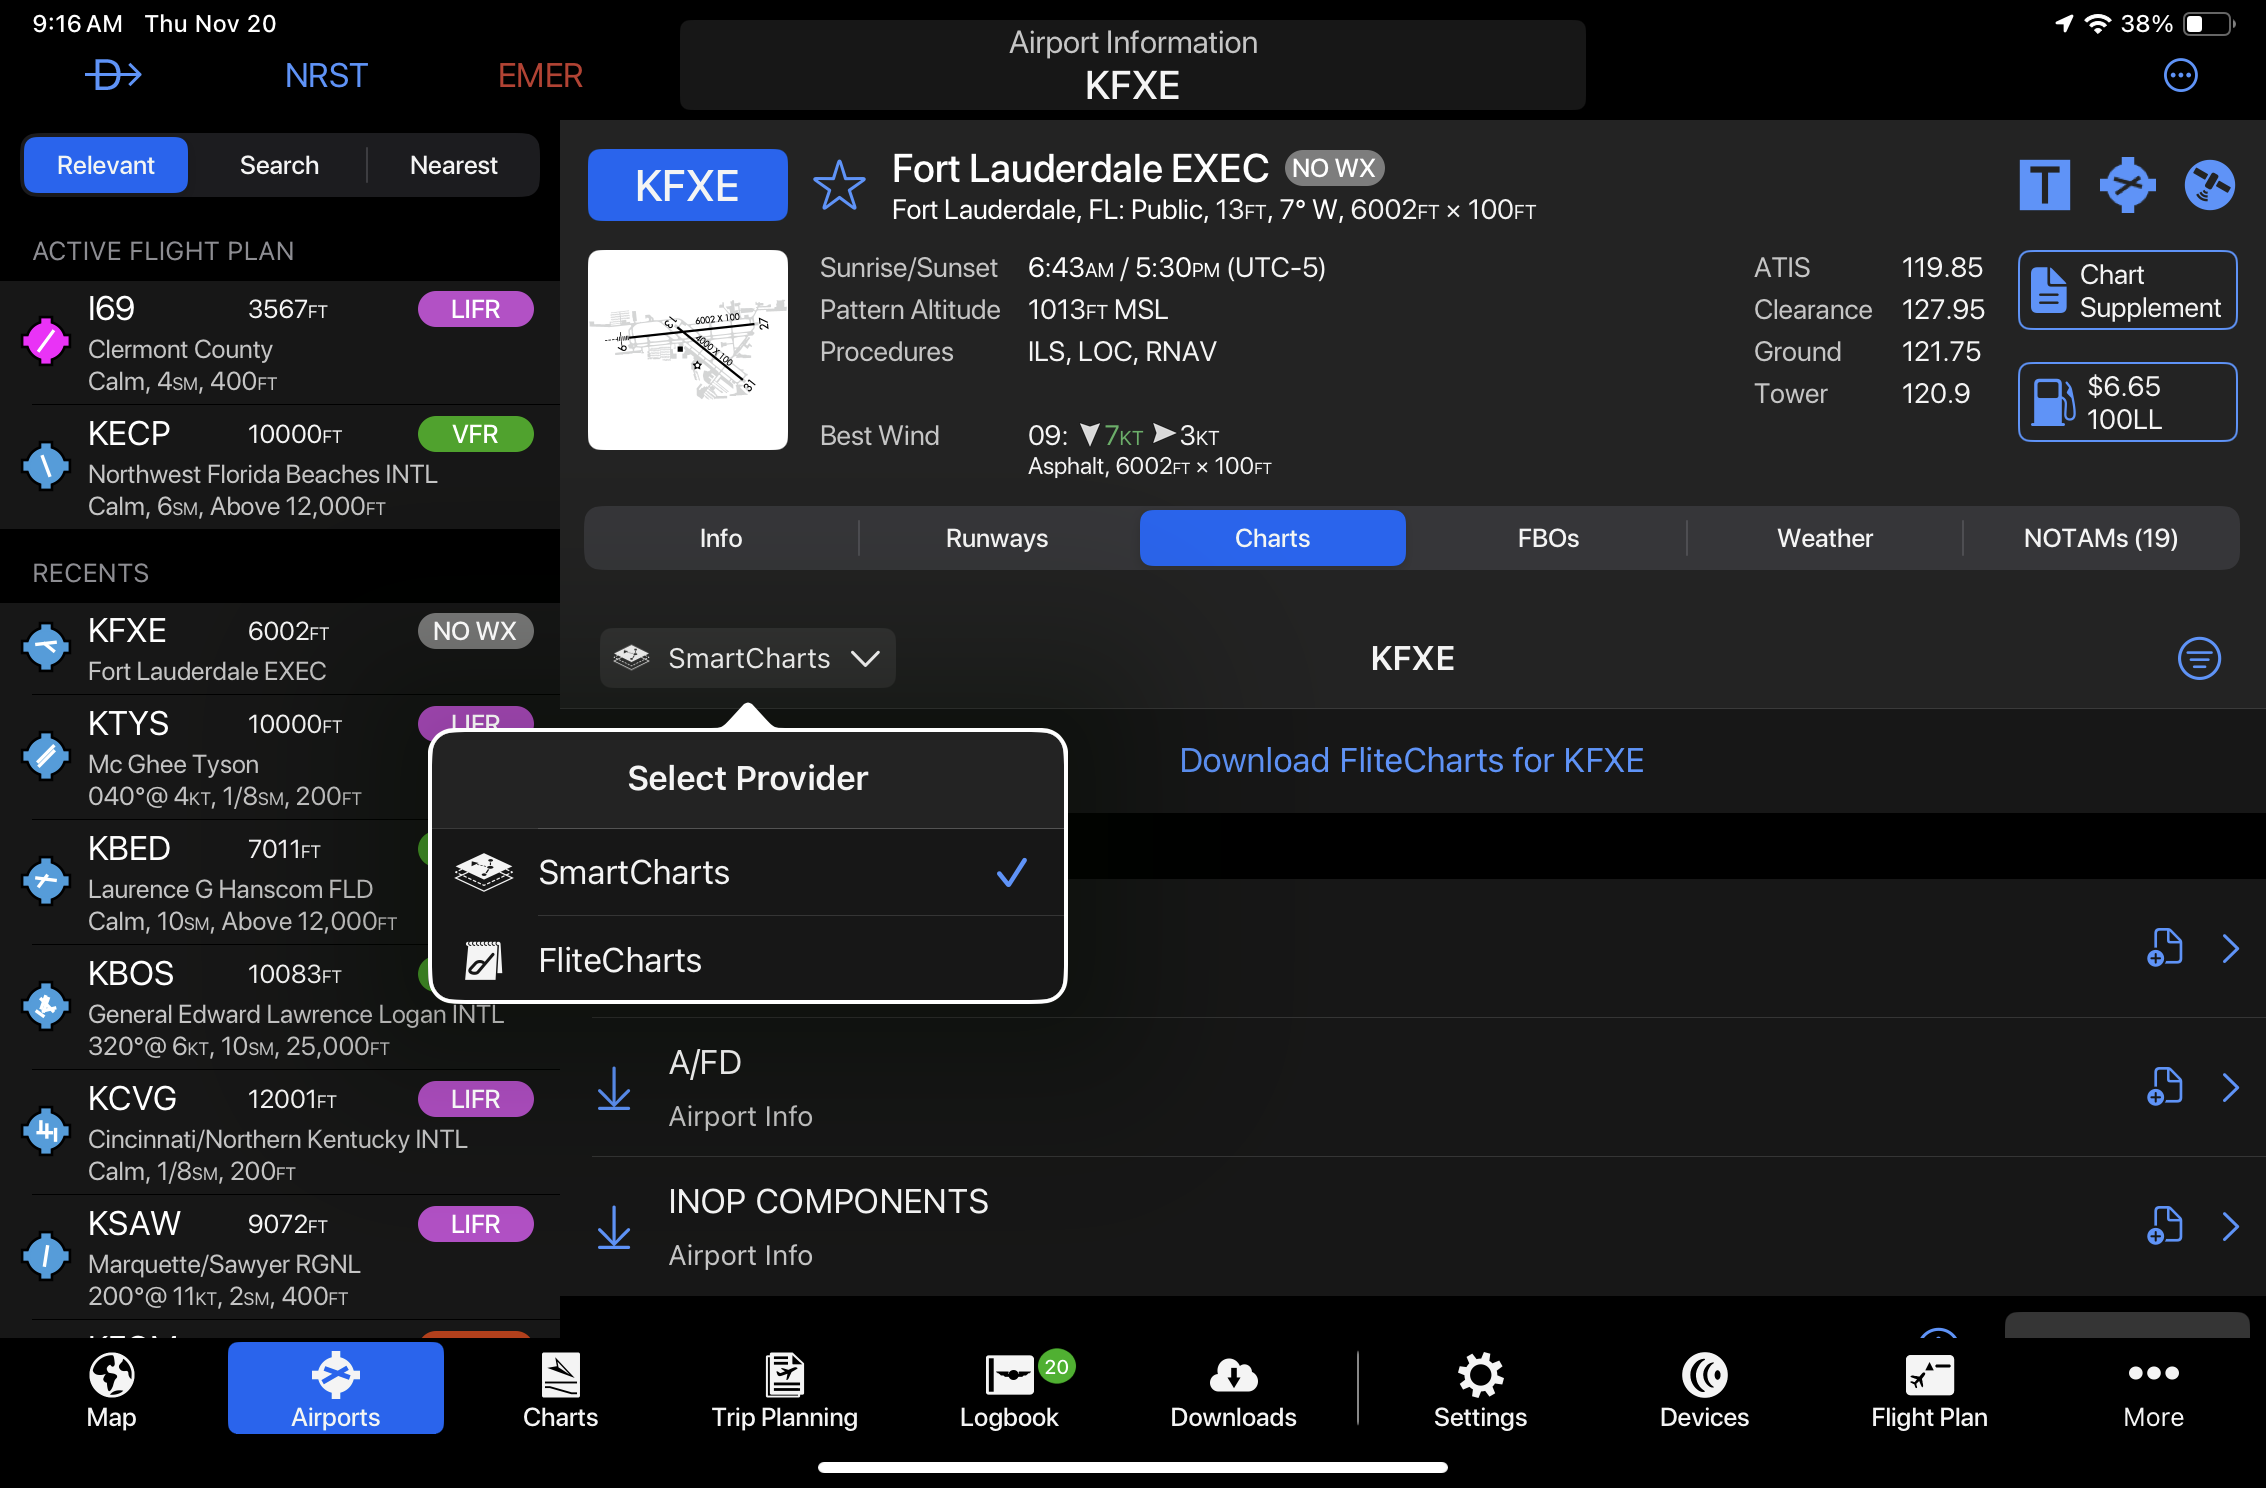
SmartCharts specifically require a Garmin Pilot Premium Subscription, and can be accessed from the Airports page. To switch to viewing these instead of FAA charts, tap the toggle menu in the middle of the screen and select SmartCharts:
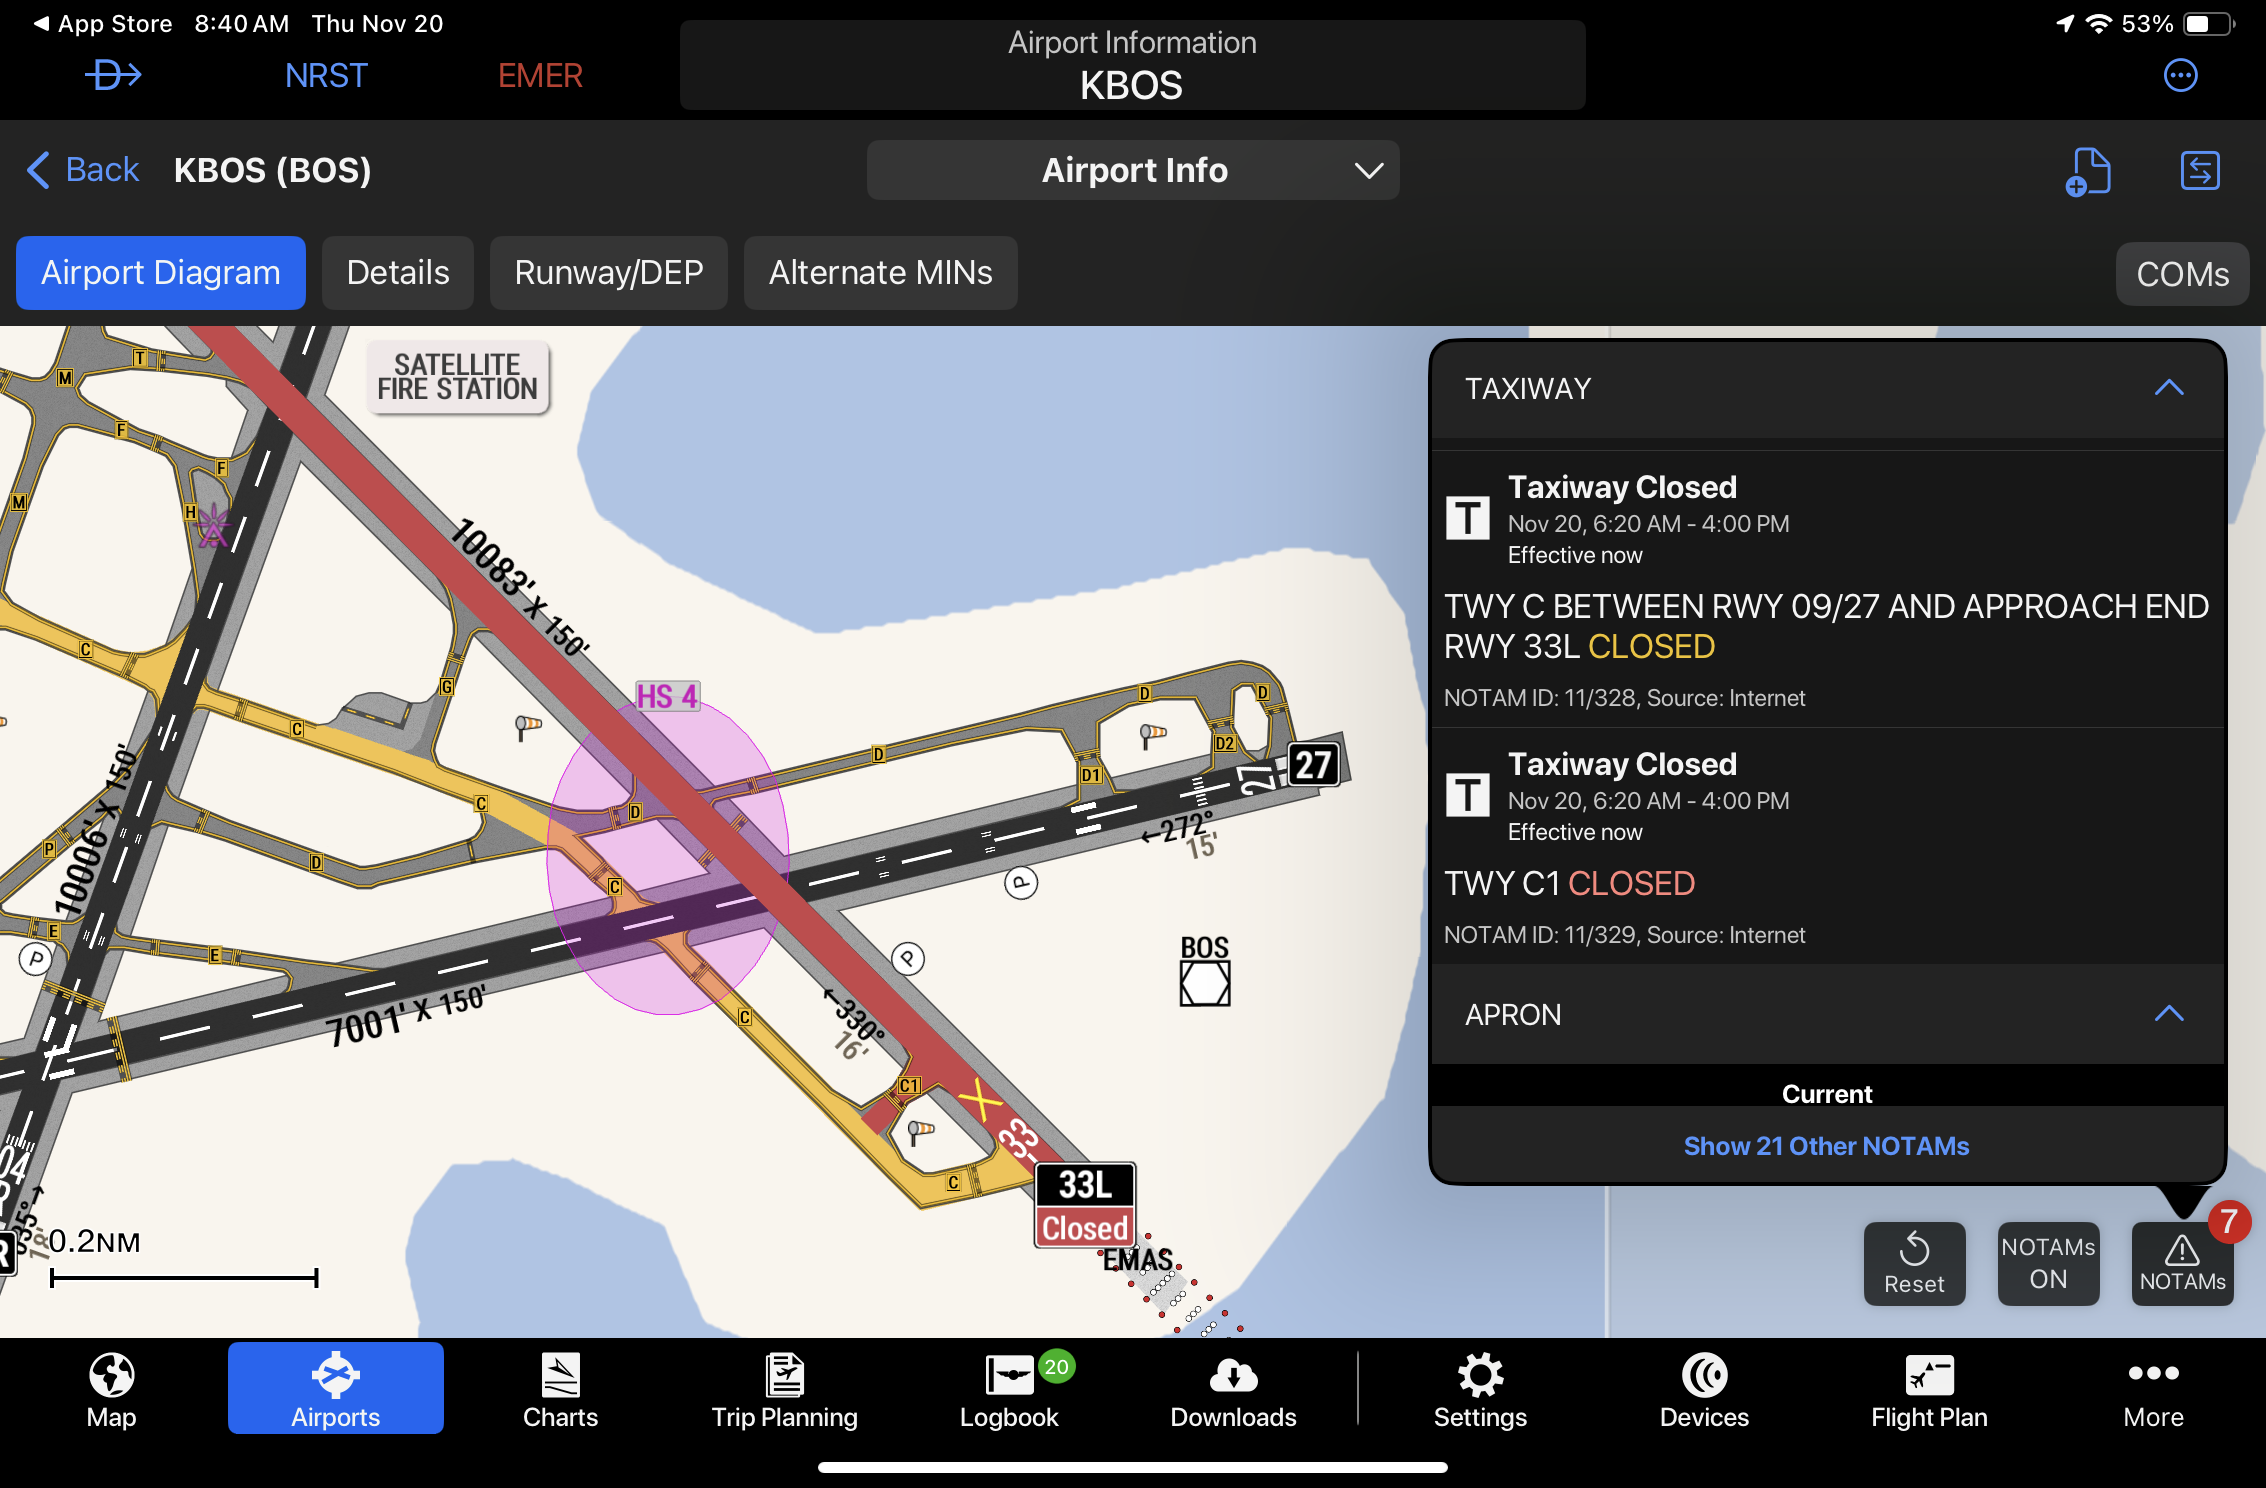
Next, tap the Airport Diagram button to view the full-color airport map. The latest update to Garmin Pilot adds dynamic NOTAM overlays to these charts, showing closed runways, taxiways, and runway braking action (FICON):
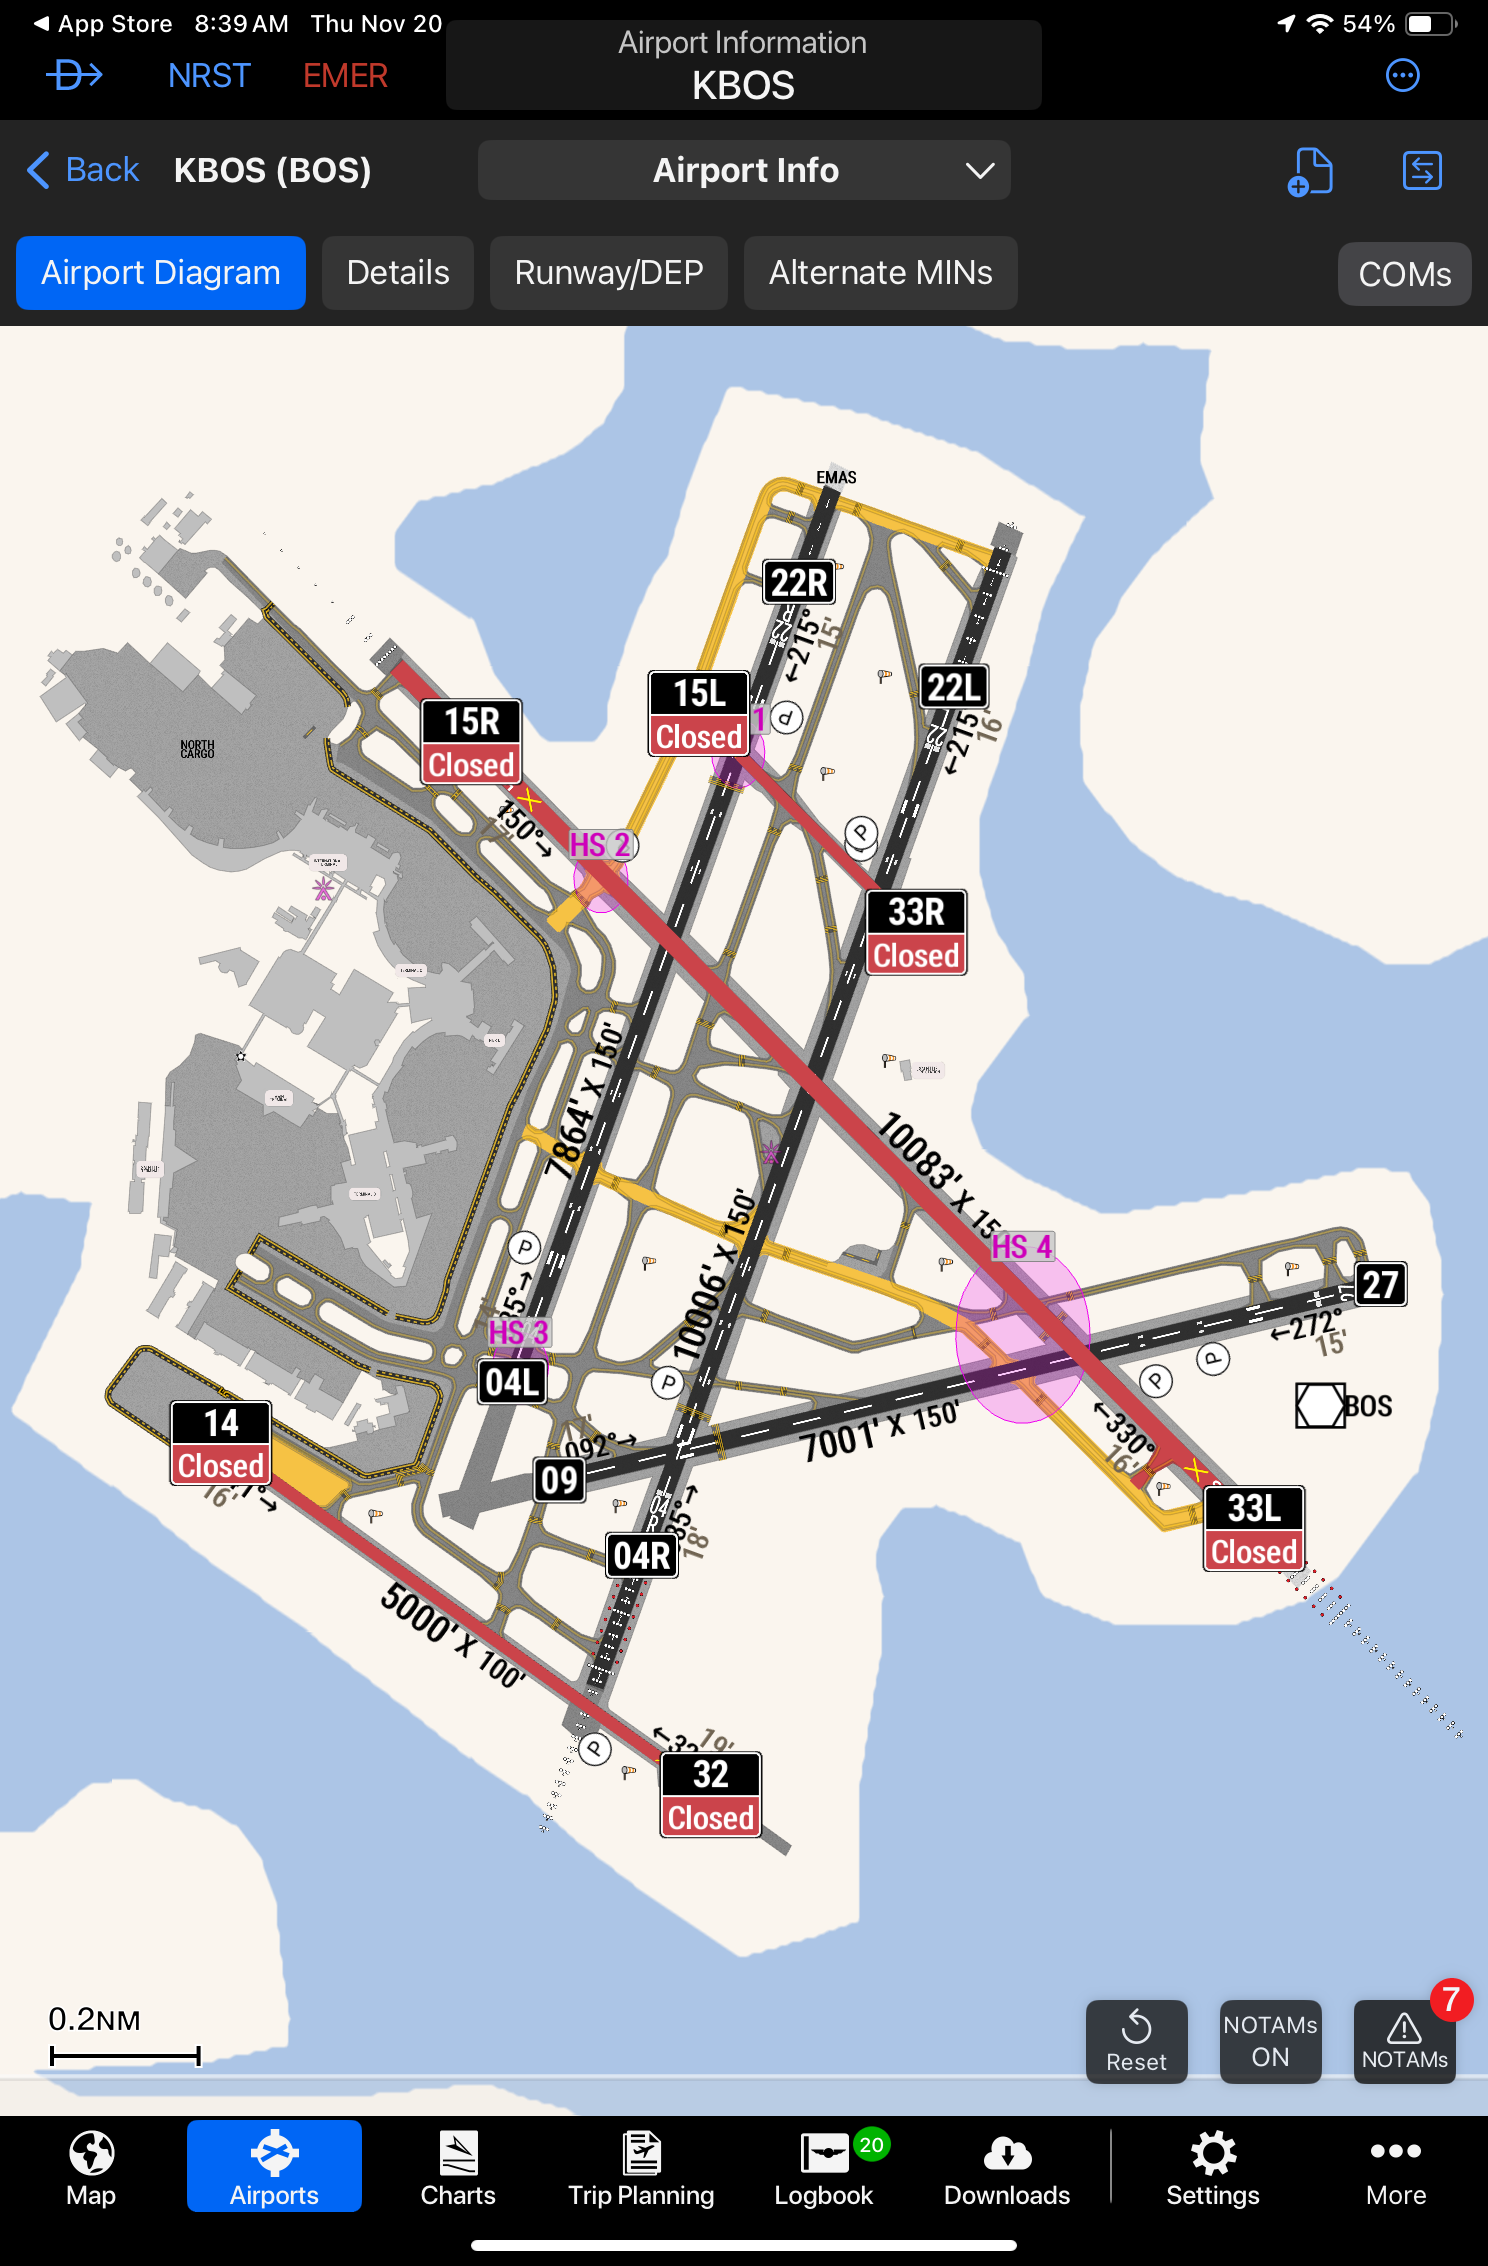
If you zoom in, full runway and taxiway closures are highlighted in red, and partial taxiway closures are highlighted in yellow, indicating that at least one segment of that taxiway is closed. Tap the NOTAMs button at the lower right to read the details:
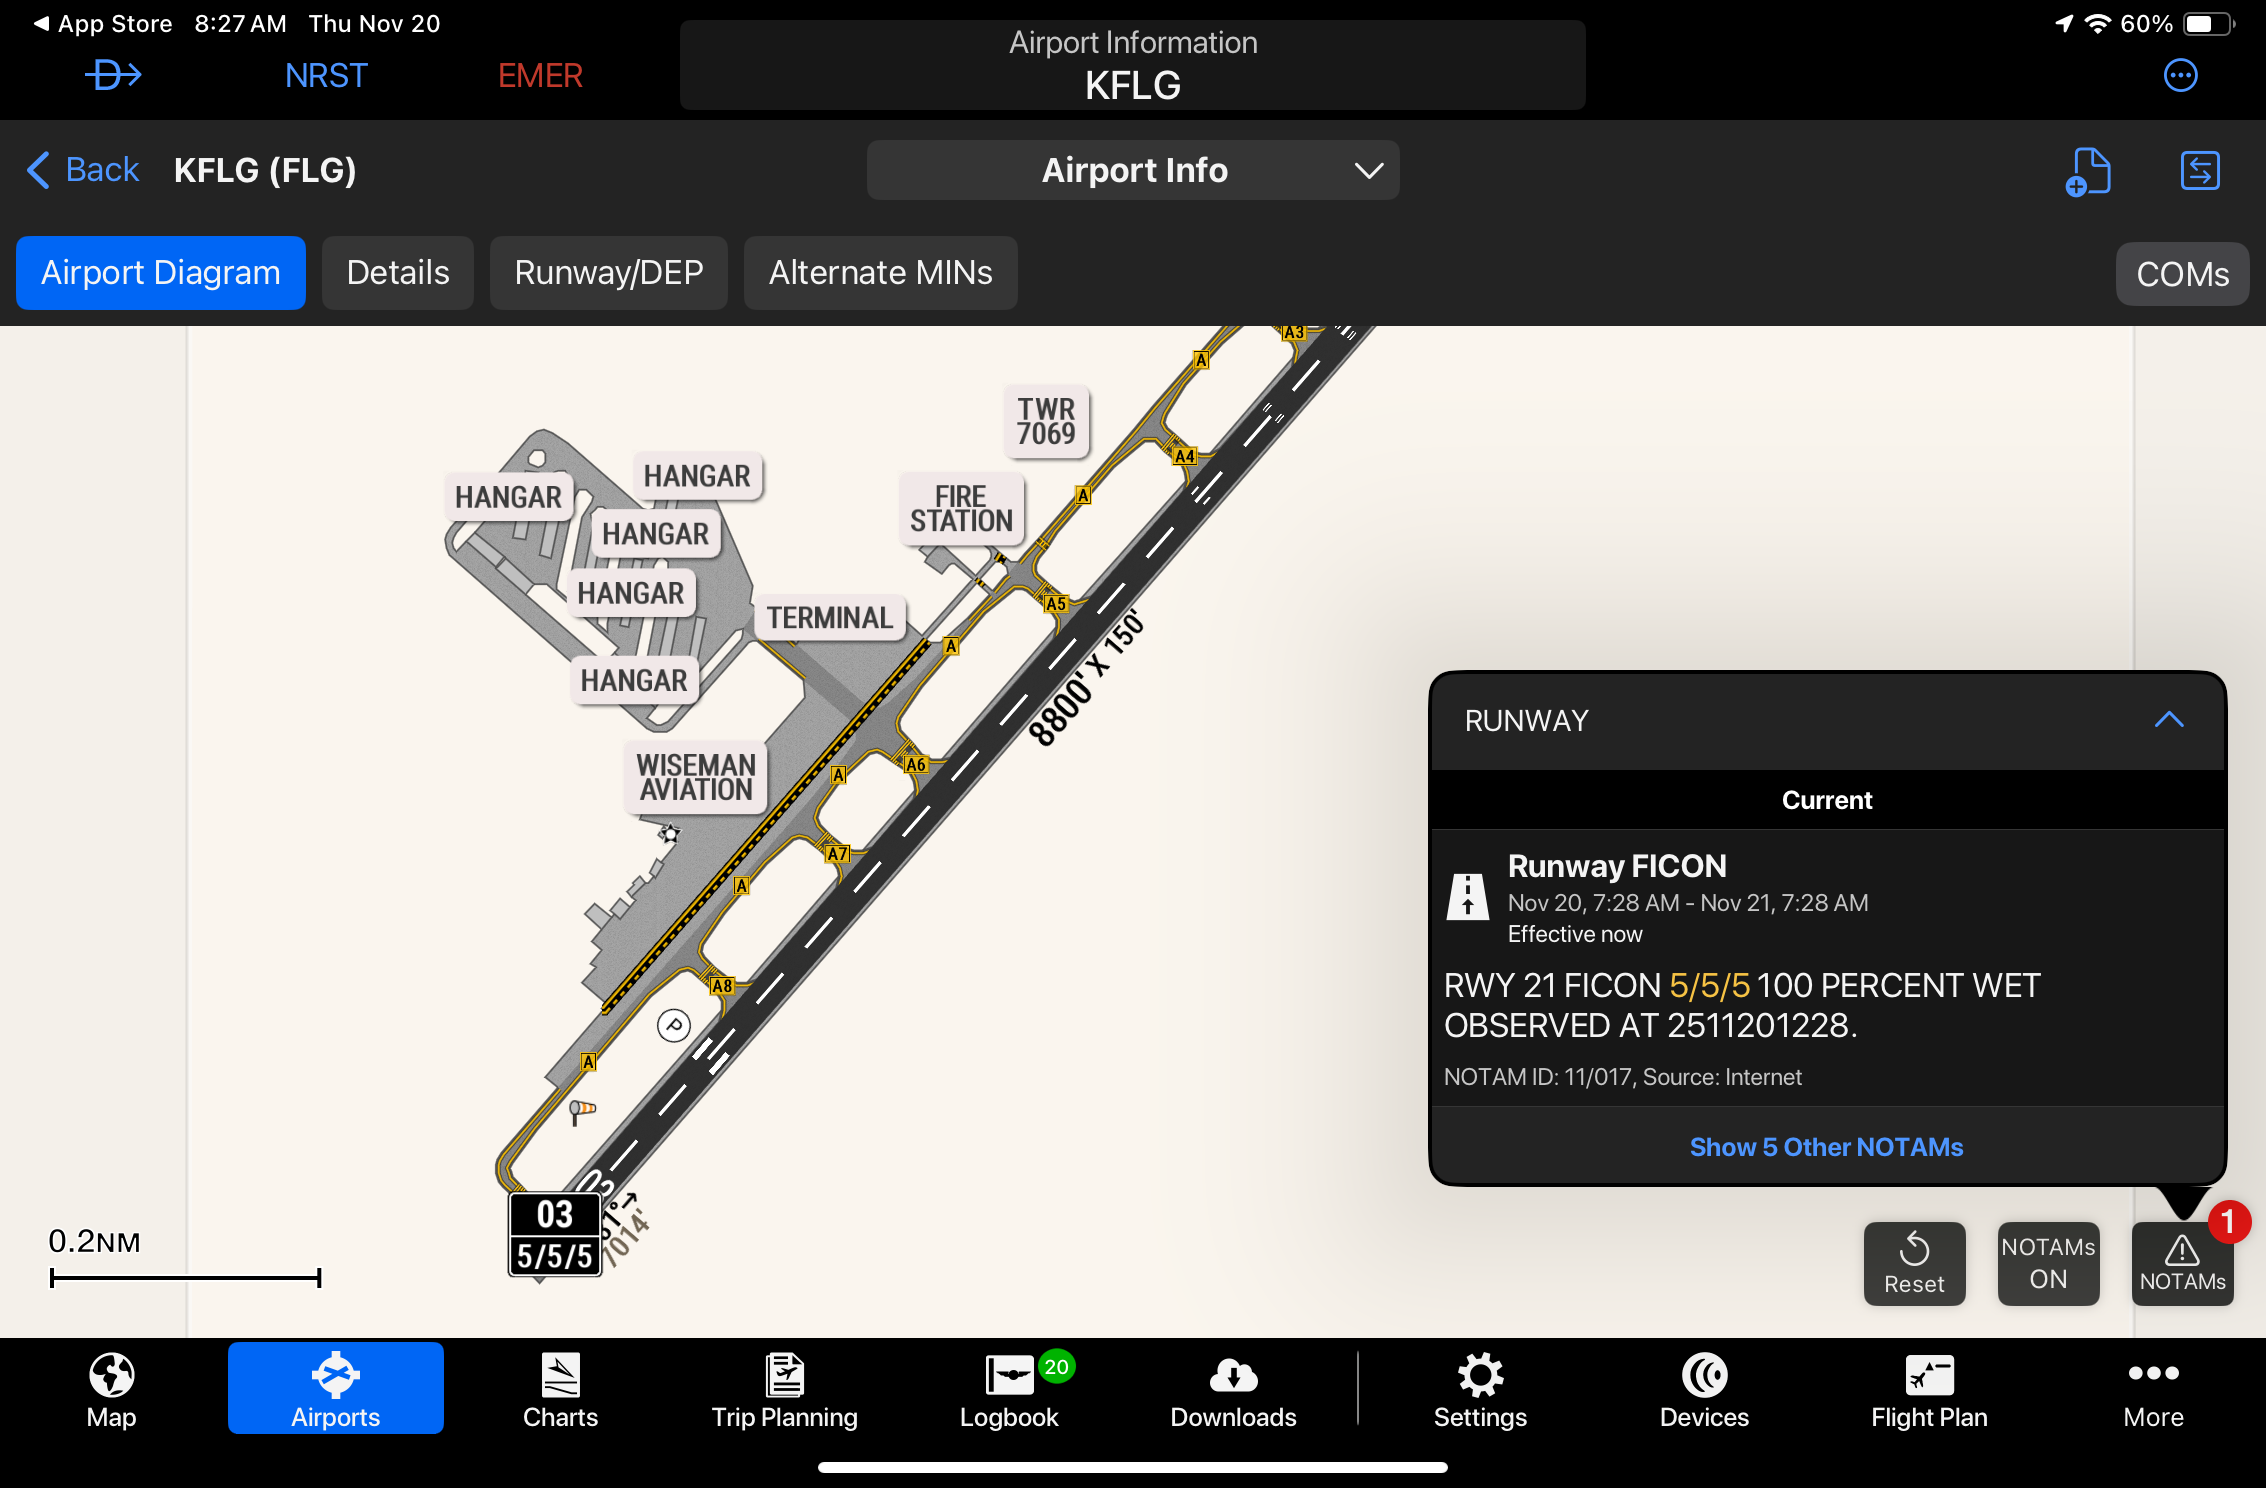
SmartCharts will also display the braking condition when a Field Condition (FICON) NOTAM is issued for a wet or contaminated runway. These contain three numbers, representing the braking action for the first third, middle third, and last third of the runway. In the example below, 5/5/5 means the runway is wet, but has no significant braking issues. These values ramp down to a value of 1 or 0, equating to poor or nil braking:
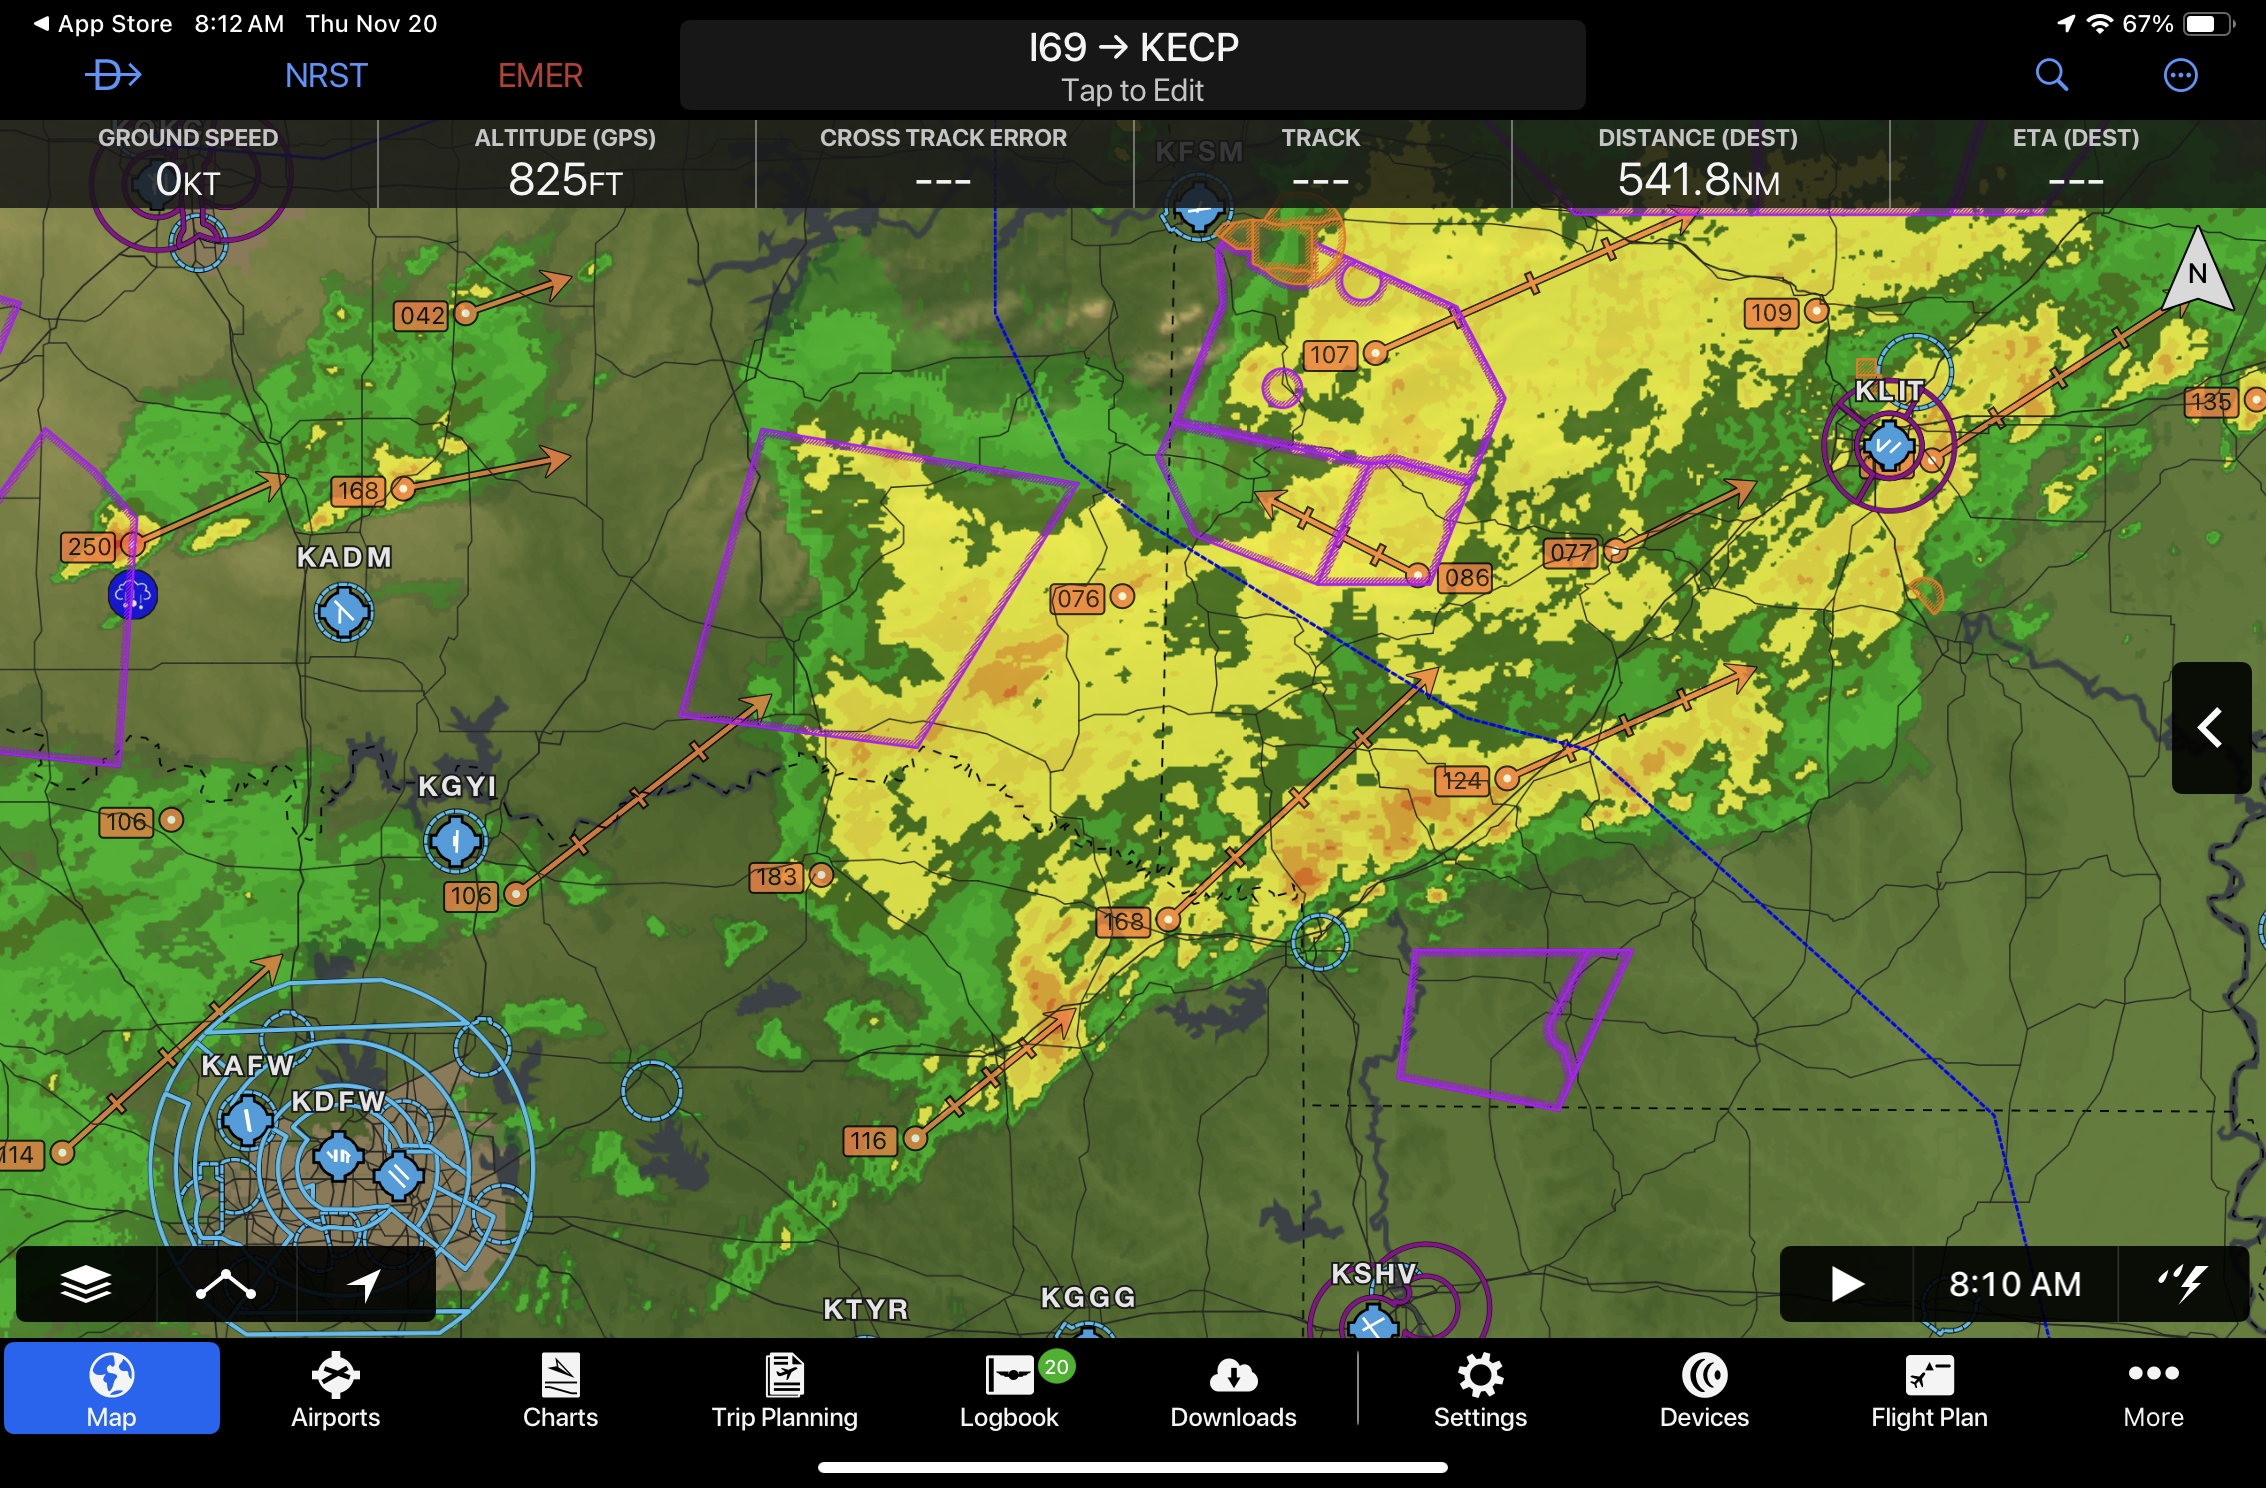
Garmin also added a minor update to the weather radar overlay. You’ll now see storm top heights (MSL) numerically depicted on storm cell markers:
Lastly, this update includes the following bug fixes and improvements:
- Restored the Evaluate Departure Time Details section of the Leidos weather briefing
- Resolved the issue with receiving RNAV approaches from G1000NXi for some airports
- Fixed the Database Concierge transfer page when using light mode
- Added message No published COM frequencies to SmartCharts details and quick access bar
- Updated the url to manage Jeppesen licenses
- Improved syncing for pilots, aircraft and trips across devices and platforms
- For GDL 60 users with selected avionics, added ability to view battery charge as a percentage on the aircraft dashboard
Download the Garmin Pilot app here
- How to flight plan around thunderstorms using your iPad - July 15, 2026
- Garmin Pilot app simplifies flight planning for pilots - July 10, 2026
- What’s the best iPad for Pilots – 2026 Edition - June 29, 2026

